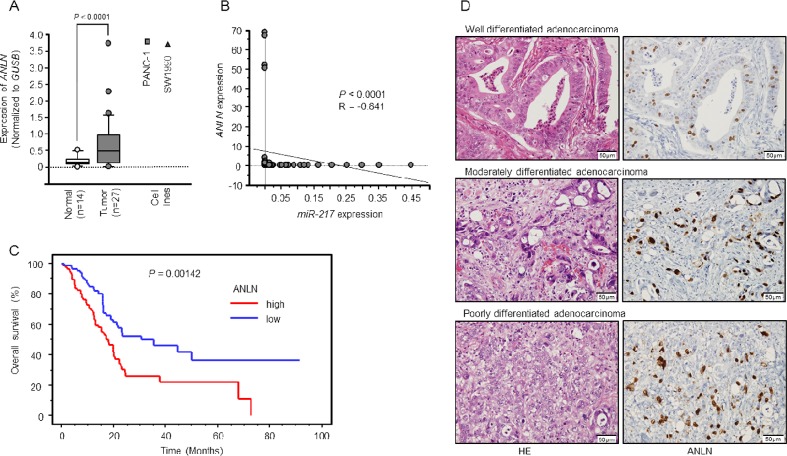
Figure 5. Expression levels of ANLN mRNA and immunohistochemical staining of ANLN protein in PDAC specimens.
(A) Expression levels of ANLN mRNA in PDAC or normal pancreatic tissues and PDAC cell lines. (B) The expression levels of miR-217 and ANLN were negatively correlated (R = −0.841, P < 0.0001). (C) Kaplan–Meier curve analysis of overall patient survival between those with high ANLN expression and low ANLN expression in the PDAC TCGA database. (D) Immunohistochemical staining of ANLN in PDAC specimens. All differentiated types of PDAC (well, moderately, poorly) showed strong nuclear immunoreactivity (Left panel: hematoxylin-eosin staining, Right panel: ANLN staining, original magnification, X400).

