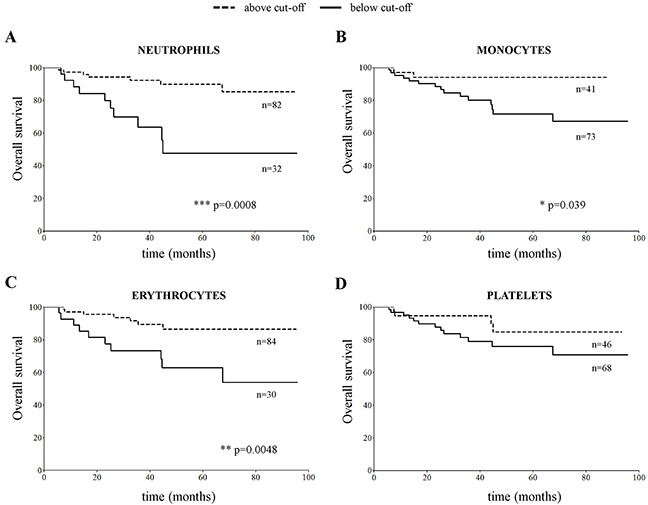
Figure 4.

Overall survival curves obtained by stratifying the CBC cohort of NB patients (N=115) with number of (A) neutrophils, (B) monocytes, (C) erythrocytes and (D) platelets in PB samples above and below the cut-off value determined for each cell population by ROC curves (5.7×10⁹/L for neutrophils, 0.4×10⁹/L for monocytes, 3.3×10¹²/L for erythrocytes and 400×109/L for platelets).
