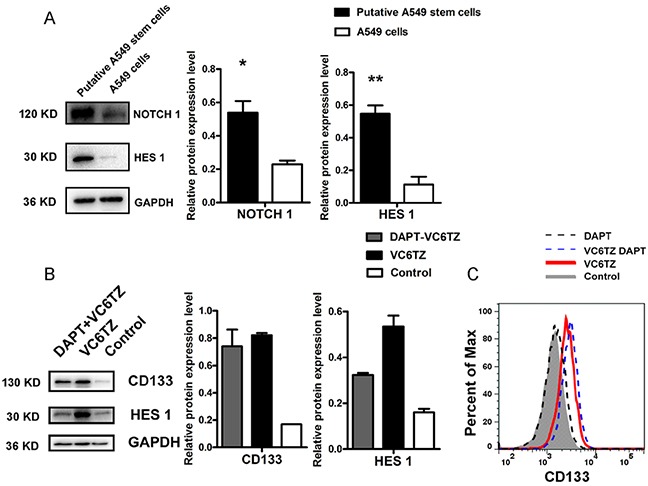
Figure 5. Relative expression of proteins in the NOTCH signaling pathway in putative A549 stem cells.

(A) Western blot results for NOTCH1 and HES1 expression levels in putative A549 stem cells and A549 cells. (B) Western blot results of CD133 and HES1 proteins in putative A549 stem cells and in cells pretreated with DAPT agent. (C) Flow cytometry results for CD133 expression in putative A549 stem cells and A549 cells after treatment with DAPT.
