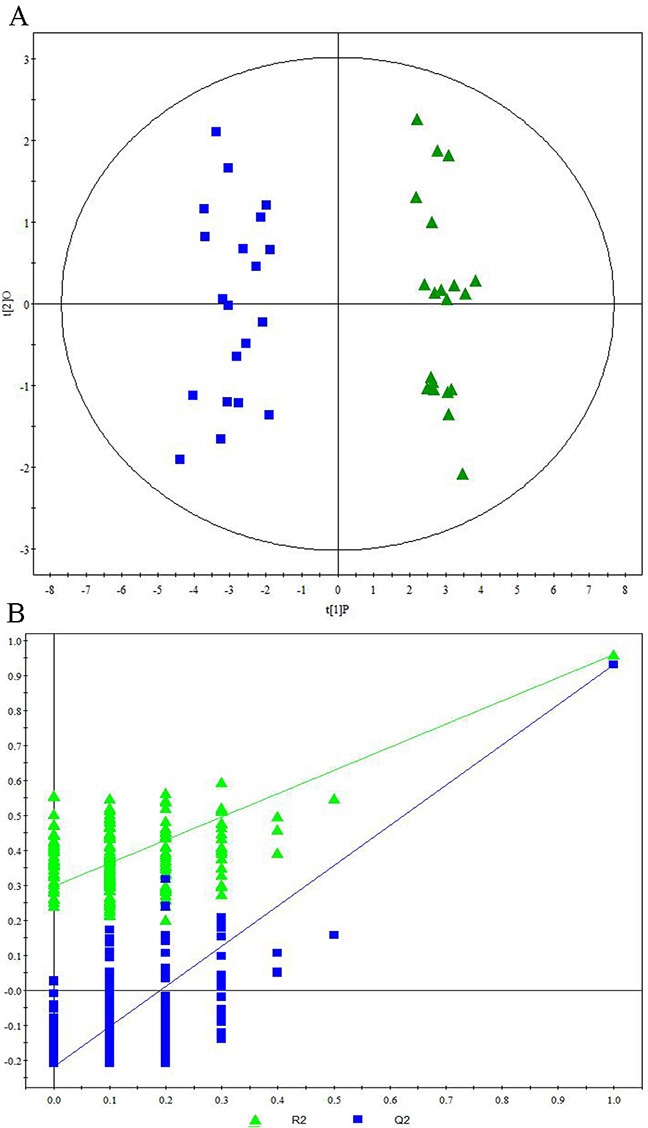
Figure 4. Metabonomic Analysis Differentiating Primary HCC Tumors from HBV-Infected Patients and HCV-Infected Patients.

(A) OPLS-DA score plots showing a clear discrimination between primary HCC tumors from HBV-infected patients (blue circles) and HCV-infected patients (green diamonds). (B) 200× permutation testing showing the original R2 and Q2 values (top right; R2 =0.960, Q2=0.936) as significantly higher than corresponding permuted values (top right), demonstrating the OPLS-DA model’s robustness.
