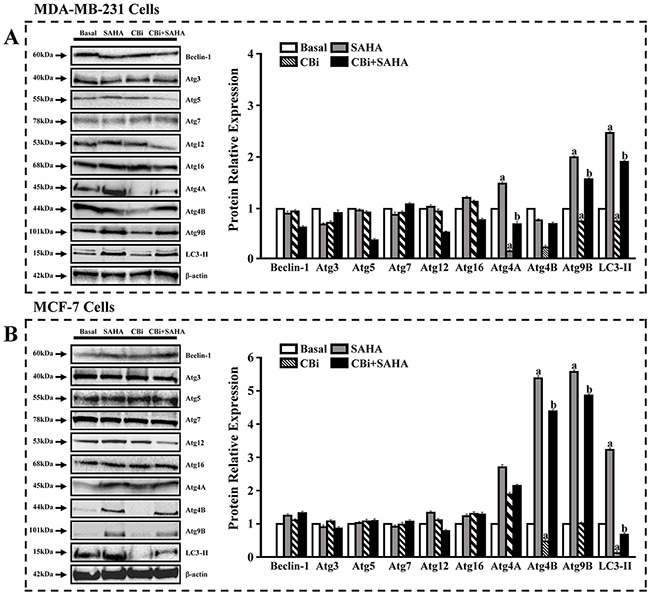
Figure 6. The effects of SAHA and Cystatin C on the expression of ATGs and LC3. Western blot analysis.

5μM SAHA and 100 ng/ml Cystatin C in treatment of MDA-MB-231 cells. 10μM SAHA and 100 ng/ml Cystatin C in treatment of MCF-7 cells. (A) A number of proteins were validated in MDA-MB-231. (B) A number of proteins were validated in MCF-7. (a) p <0.05, (b) p <0.01, when comparing to basal. Data (mean ±standard error) representative results derived from a minimum of 3 independent experiments.
