
Figure 3. A patient with moderate overlap (patient 9).
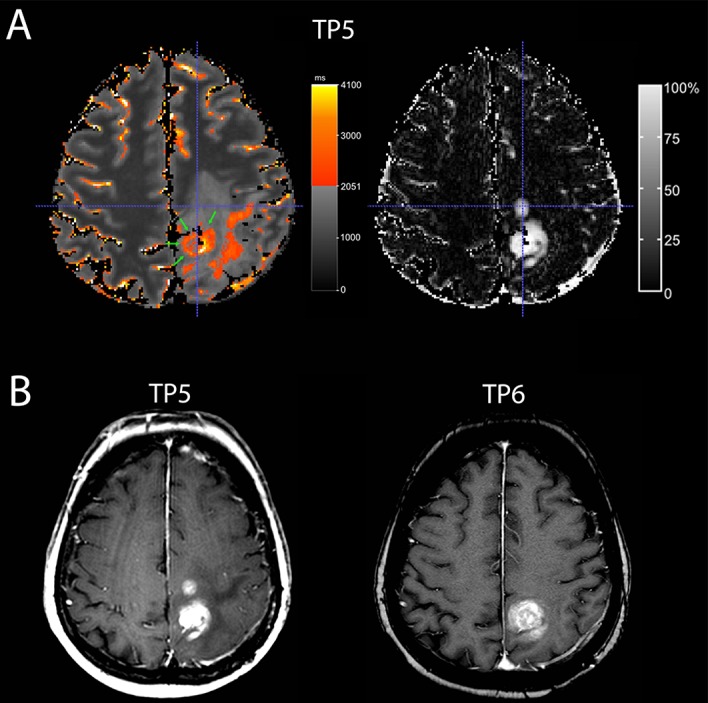
A Quantitative map with a subtraction map qT1 at time-point TP 5) (A) and conventional MRI at TP 5 and TP 6 (B) of a 70-year-old woman with recurrent GBM. At TP 5, the quantitative map (A, on the left-hand side) shows pre-GBCA qT1 area with >2051 ms (red to yellow, green arrows) with a good overlap of the dorsal contrast-enhancing tumor seen on the subtraction map ΔT1 (A, on the right-hand side), but the second smaller contrast-enhancing tumor area (crosshair) is missing on the color map. This contrast-enhancing area without overlap (crosshair) regressed in the next conventional MRI (TP 6) (B), whereas the contrast-enhancing tumor with overlap progressed. Also, note additional area of T1-prolongation outside the contrast-enhancing tumor.