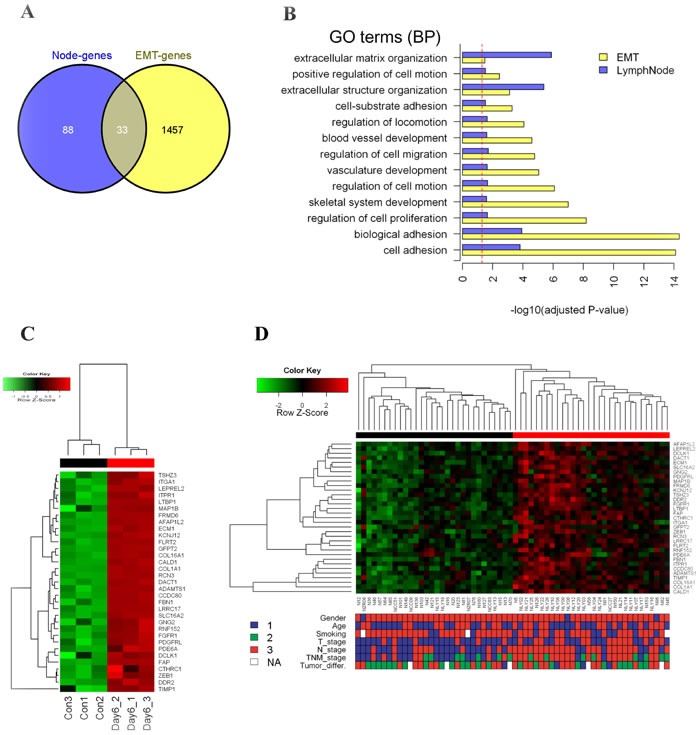
Figure 2. Identification of EMT-related genes in NSMs of lung SCC with lymph node metastasis.

A. Venn diagram showing the overlapped 33 genes between EMT model (EMT-genes) and lymph node derived genes (Node-genes). B. Overlapped significant GO BP terms between EMT-genes and Node-genes in (A). X-axis indicates -log10 transformed Benjamini-Hochberg adjusted P-value. Dash line indicates significant cutoff (adjusted P-value = 0.05). C. Unsupervised hierarchical clustering analysis of the 33 genes on the EMT model dataset (red bars indicate EMT-active cells, black for the control). The colored matrix indicates the relative expression level of genes (red for higher expression, green for lower, the same to D). D. Unsupervised hierarchical clustering analysis of the 33 genes on the NSMs dataset (red cluster with up-regulated pattern of 33-gene was defined as active cluster, while the down-regulated was defined as inactive cluster). The down panel shows the corresponding clinical parameters of patients, and compared with two gene-expression clusters: Gender (1: female, 3: male, Fisher's exact test P-value = 1); Age (1: < 60 years, 3: ≥ 60 years, chi-square test P-value = 0.79); Smoking (1: <20 package years, 3: ≥ 20 package years, chi-square test P-value = 0.068); T_Stage (1: T1&T2, 3: T3&T4, chi-square test P-value = 0.03); N_Stage (1: N0, 3: N1&N2, chi-square test P-value = 0.0007); TNM_Stage (1: I, 2: II, 3: III, chi-square test P-value = 0.0007); Tumor_differ. (tumor differentiation, 1: well, 2: Moderate, 3: poor, chi-square test P-value = 0.38).
