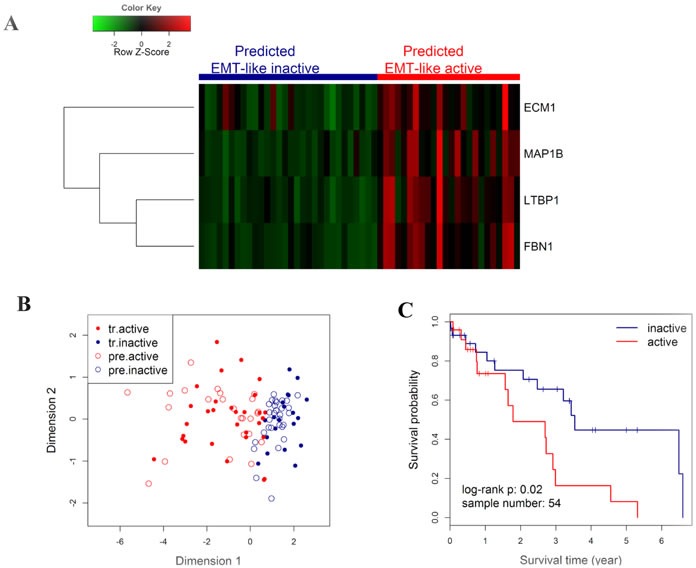
Figure 5. Outcome prediction in an independent NSCLC cohort from TCGA by EMT-like kNN predictor.

A. Heatmap showing the expression level of the 4 genes in the TCGA cohort, with colored bars on the top panel indicating the EMT-like status of each individuals as predicted in B. The colored matrix indicates the relative expression levels of 4 genes by RNA-seq (red for higher expression, green for lower). B. Scatter plot for kNN predicted (k = 5) results. Patients from TCGA were predicted by kNN classification model using the CICAMS cohort as training set. The 2-dimension scatter plotting indicates all samples by classical multidimensional scaling using Euclidean distance. Solid points indicate the training samples in CICAMS cohort, with red indicating the training active pattern (tr.active) and blue for the training inactive pattern (tr.inactive). Circles indicate the test samples in TCGA cohort, with red indicating the predicted active pattern (pre.active) and blue for the predicted inactive pattern (pre.inactive). C. Kaplan-Meier curves and log-rank test were performed to compare the overall survival rates of patients with different EMT-like status predicted in B.
