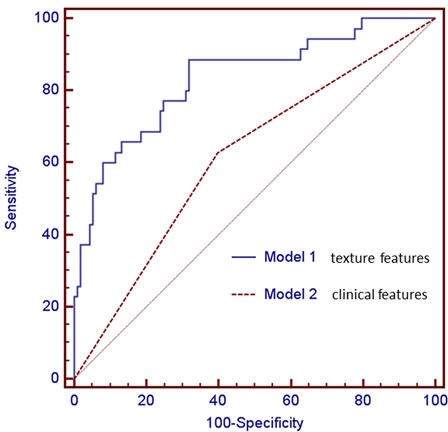
Figure 1. Comparisons of ROC curves of two logistic regression models derived from texture features (Model 1), and clinical feature (Model 2) for the prediction of pathologic grade.

The model generated with texture features (Model 1, AUC = 0.834) was superior to the model with clinical variable (Model 2, AUC = 0.615). There was significant difference in AUCs between these two models (P = 0.0001).
