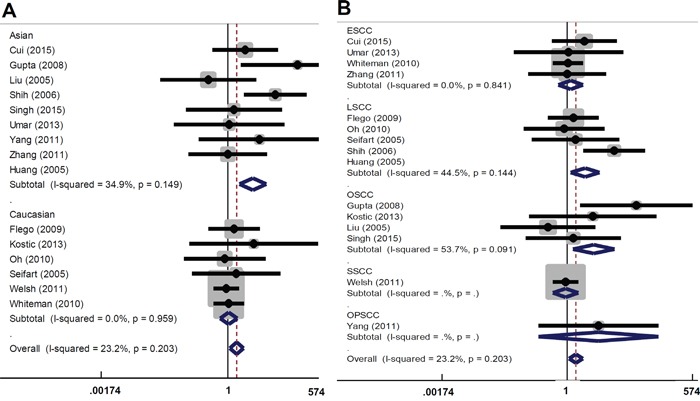
Figure 3. Forest plot for the association between TNF-α rs1800629 polymorphism and the risk of SCC under AA vs GG+GA model.

(A) Subgroup analyses based on ethnicity; (B) Subgroup analyses based on disease type.

(A) Subgroup analyses based on ethnicity; (B) Subgroup analyses based on disease type.