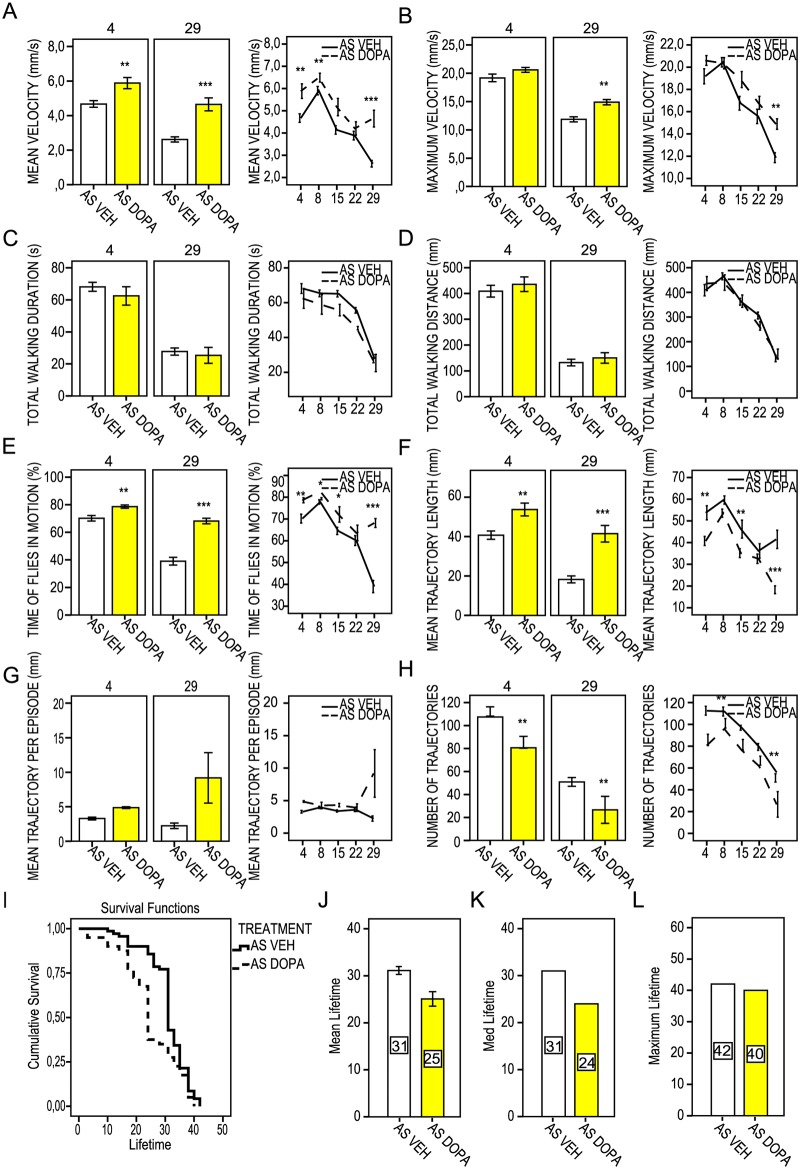
Fig 8. FlyTracker acquired kinetic parameters for control aS-expressing flies measured at 4, 8, 15, 22 and 29 days of adult fly drug feeding regime treated with either vehicle (w; +; UAS-Hsap/nSyb-Gal4; AS VEH, white bars) or with L-DOPA (w; +; UAS-Hsap/nSyb-Gal4; AS DOPA, yellow bars) at the final concentration of 1mM.
Scattered line and bar diagrams represent mean values (n = 10). Error bars indicate ± SE. * P < 0.05; ** P < 0.01; *** P <0.001. (A) Mean velocity (mm/s). (B) Maximum velocity (mm/s). (C) Total walking duration (s). (D) Total trajectory length (mm). (E) Fly motion (%). (F) Mean trajectory length (mm). (G) Mean trajectory length per episode (mm). (H) Number of fly walking trajectories. (I) Cumulative survival of vehicle-treated aS flies (w; +; UAS-Hsap/nSyb-Gal4; AS VEH) and aS flies treated with L-DOPA (w; +; UAS-Hsap/nSyb-Gal4; AS DOPA). (J) Mean, (K) median and (L) maximum lifetime. Numbers in bars represent days of mean, median and maximum lifetime.

