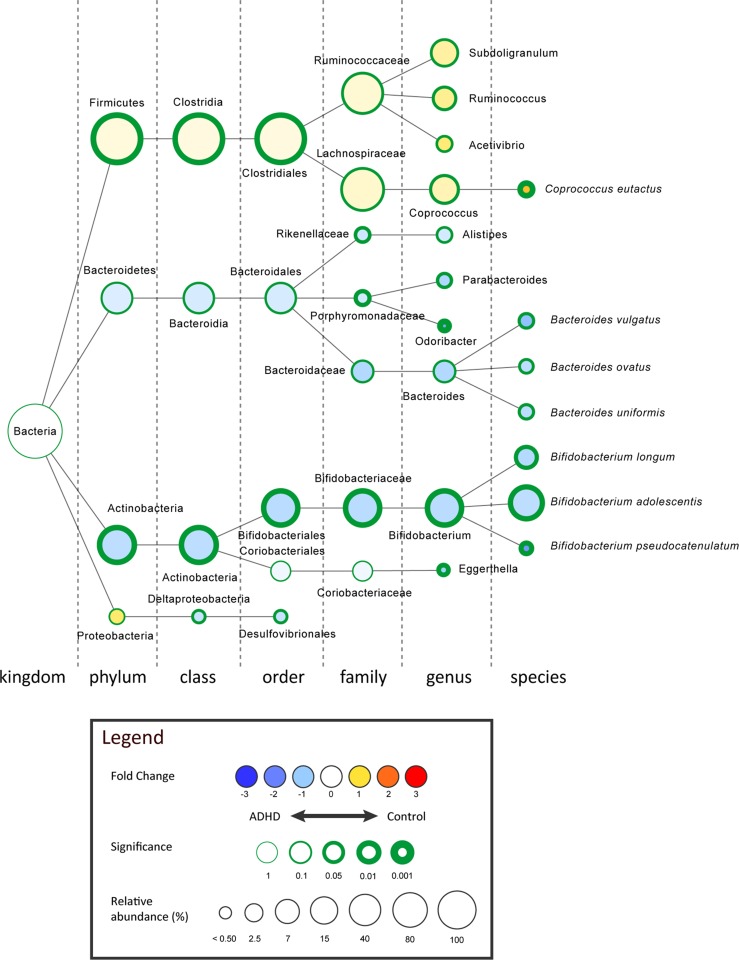
Fig 3. The strongest differentially abundant microbial taxa for ADHD cases (n = 19) versus healthy controls (n = 77), shown in the graphical Cytoscape visualization [32].
Nodes represent taxa (node size represents average relative abundance, for both experimental groups combined), edges (dashed lines) link the different taxonomic levels. The weighed fold-change (node color) is calculated as the 2log of the ratio of the relative abundance between control and ADHD (0 = no difference between genotypes, 1 = twice as abundant in control, etcetera). In other words: yellow to red indicates an overrepresentation in control, hence an underrepresentation in ADHD, and vice versa for light- to dark blue. The significance (node border width) is expressed as the p-value of a Mann–Whitney U test, uncorrected for multiple comparisons.

