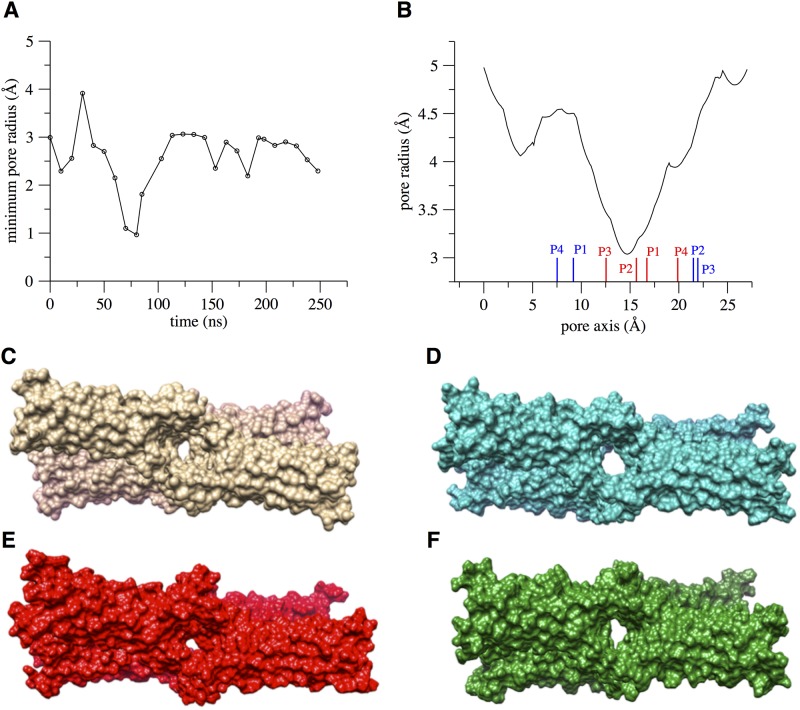
Fig 9. The pore size and structure in the single-pore system.
A, time evolution of the minimal pore radius along the single-pore simulation. B, the pore profile along the channel axis for the configuration taken at 130 ns, with red and blue bars indicating the Cα positions of D55 and D64 residues, respectively. C, the starting conformation of the single-pore model and three snapshots extracted from the simulated trajectory at 30 ns (D), 80 ns (E), and 130 ns (F).

