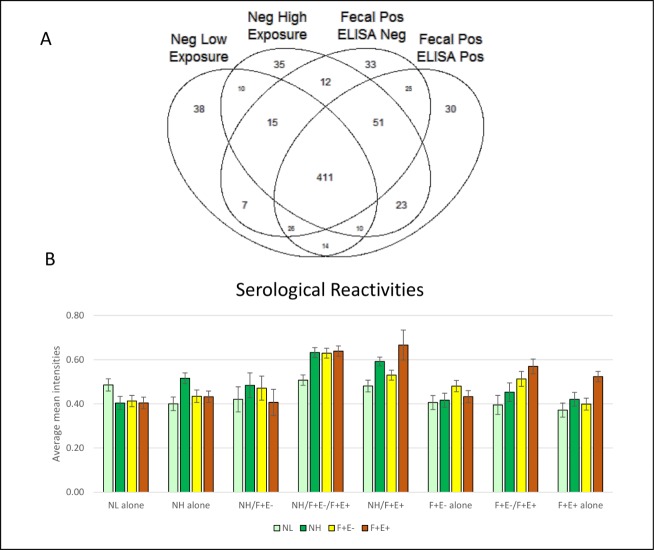
Fig 1. Highly reactive proteins identified in MTB microarray.
(A) Venn diagram at 10% threshold shows antigen hit number distribution of all 4 groups: negative low exposure (NL), negative high exposure (NH), fecal positive & ELISA negative (F+E-), and fecal positive & ELISA positive (F+E+). The four ellipses show the total number of hits from four groups and majority antigens are shared among 4 groups. The non-overlapping parts of the 4 ellipses represent the unique antigens for each group. (B) Serological reactivity in selected groups. Normalized mean intensities in each group on unique and shared antigens. The height of bars represents the mean intensity. Standard error bars are added to each column.

