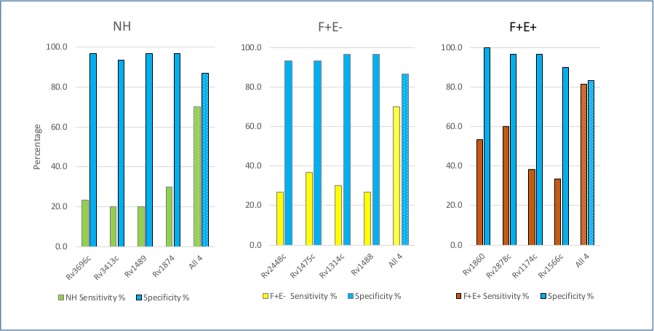
Fig 4. Increased sensitivities with antigen combinations.
Columns filled with blue color represent specificity (%) and columns filled with green, yellow, and crimson represent sensitivity (%) in NH, F+E-, and F+E+ groups. Columns filled with solid color indicate individual protein and columns filled with texture indicate combined proteins.

