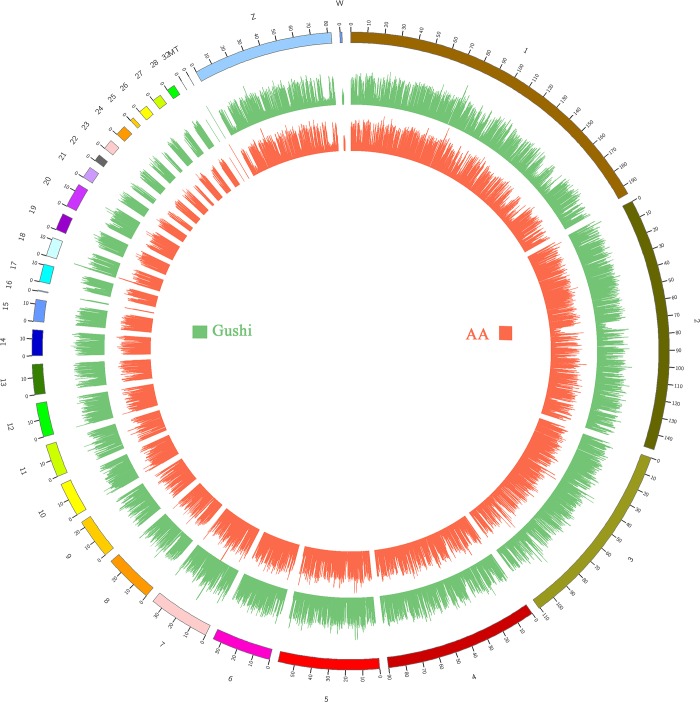
Fig 1. Genome coverage map.
The outermost circle is the genome, the first inner circle shows the chromosome coverage of the AA chicken (AA), and the second shows that of the Gushi chicken (Gushi). The number on the outer circle represents the chromosome number, the number on the inner circle represents the position on the chromosome, and the unit is Mb.

