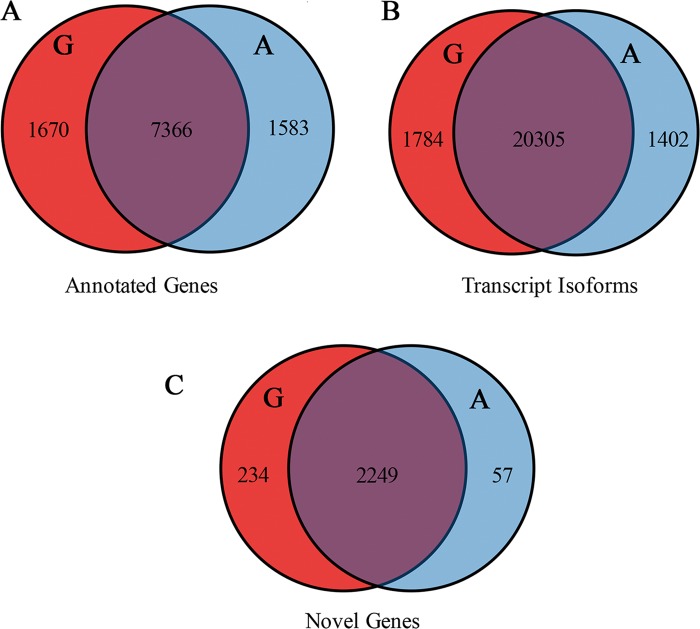
Fig 3. Venn diagram of global annotated genes, transcript isoforms and novel genes expressed in Gushi chickens and AA chickens by Ribo-Zero RNA sequencing.
Venn diagrams show the distribution of annotated genes (A), transcript isoforms (B), and novel genes (C) detected in Gushi chickens and AA broilers. Red indicates Gushi chickens, and blue indicates AA chickens.

