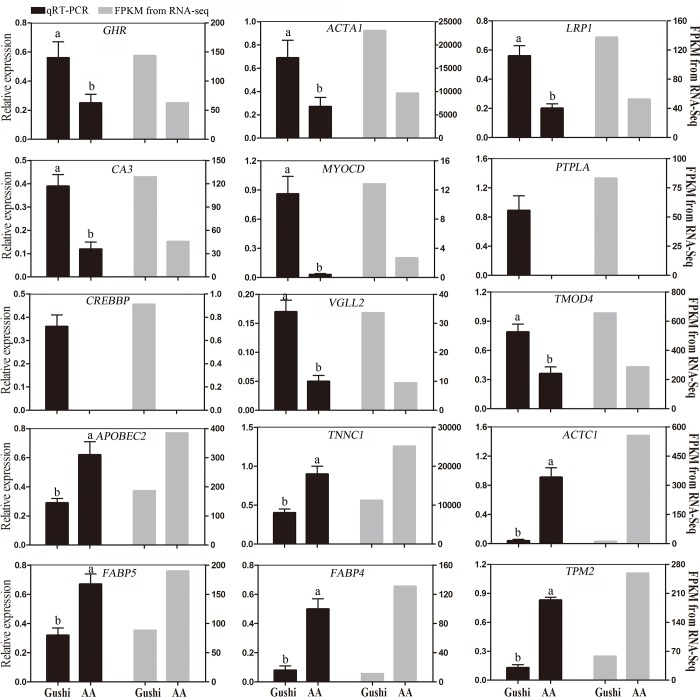
Fig 8. Validation of RNA-Seq data by qRT-PCR.
Data were analyzed by the 2–ΔΔCt method using GAPDH as a reference gene. The results are presented as fold changes in expression. Each column represents the means ± SEM from 3 biological replicates with each measurement repeated 3 times. Different lowercase letters indicate significant differences in expression levels between the two breeds (P ≤ 0.05). Black bars = qRT-PCR; Gray bars = FPKM from RNA-Seq.

