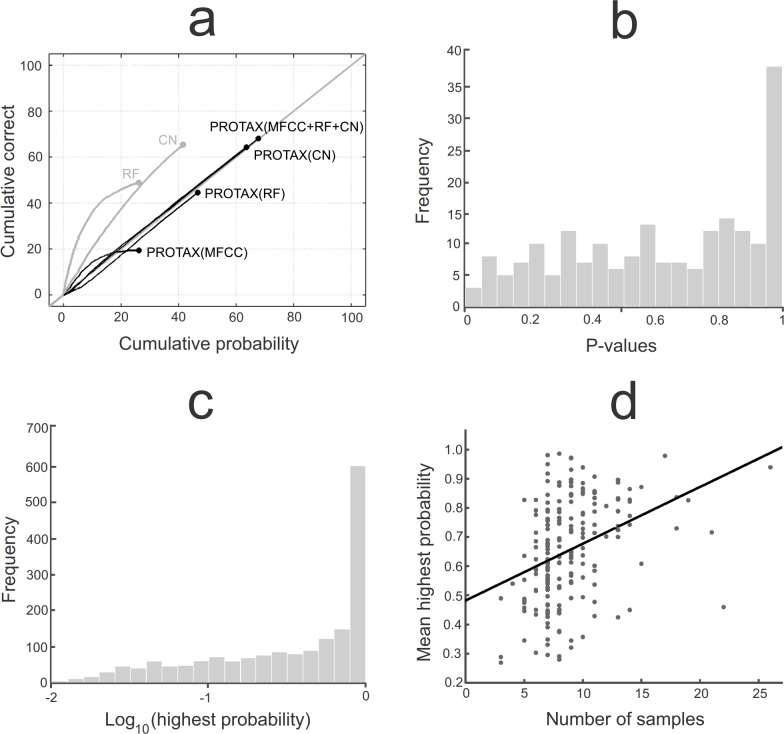
Fig 3. Accuracy and bias of 1766 test samples identified by different versions of PROTAX-Sound, Random Forest and Convolutional Neural Network classifiers.
Panel a) shows reliability diagrams for the best outcome species (x-axis) and the cumulative correctness of the prediction (y-axis). The six lines correspond to the raw output of Random Forest (RF), the raw output of Convolutional Neural Network (CN) and the PROTAX-Sound models that use MFCC, RF, CN or their combination as predictors. The model-predicted probabilities are calibrated if the lines follow the identity line (the grey diagonal line), and they are the more accurate the higher the lines reach. Panel b) shows the distribution of p-values for the 200 species classified by PROTAX-Sound (MFCC+RF+CN), asking if the classifications are not calibrated for some particular species. Panel c) shows the distribution of the highest PROTAX-Sound (MFCC+RF+CN) probabilities predicted for each of the test samples. Panel d) shows the highest PROTAX-Sound (MFCC+RF+CN) probability against the number of reference samples. In this panel, each dot corresponds to each of the 200 species, and the probabilities are averaged over all test samples that belong to the species.

