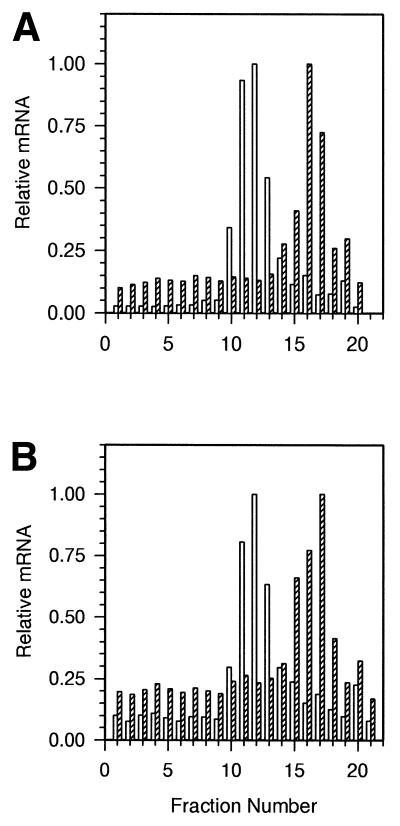
Figure 2.
A northern blot analysis of the polysomal distribution of C/EBPβ and albumin mRNAs from (A) control mouse livers which make the 40- and 35-kDa isoforms and (B) LPS-treated mouse livers in which the 20-kDa isoform is induced. Open bars show C/EBPβ and hatched bars show albumin mRNA distribution. RNA abundance in each fraction is normalized to a value of 1.0 in the most abundant fraction.

