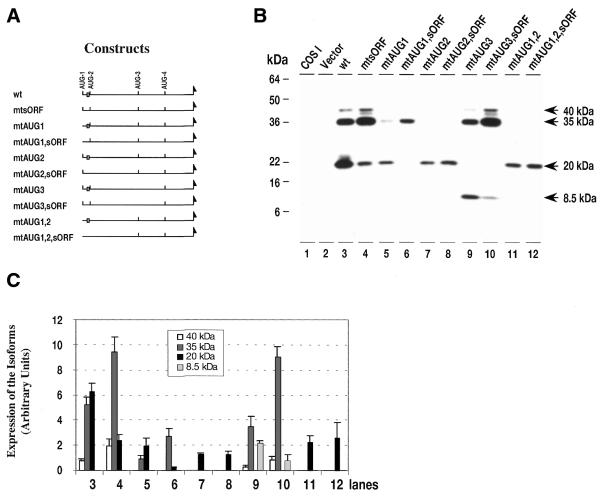
Figure 3.
Western analysis of the translation products of wild-type C/EBPβ expression vector (pCMV-C/EBPβ-wt), expression vectors with mutations at multiple AUG start sites, and mutation of the sORF-AUG. (A) Maps of the expression vectors used in (B). The open box denotes the sORF; (B) western blot analysis of proteins from COS-1 cells: lane 1, proteins from control, non-transfected COS-1 cells; lane 2, proteins from cells transfected with control vector (pCMV); lanes 3–12, proteins from cells transfected with the vector indicated. (C) Comparison of the pool levels of C/EBPβ isoforms produced by each expression vector. Protein loading was adjusted to reflect variations in vector mRNA pool levels, and translation from an equivalent mRNA pool level. Data for three independent transfections are shown as mean ± SD. The numbering of the grouped bars corresponds to the lanes in (B).

