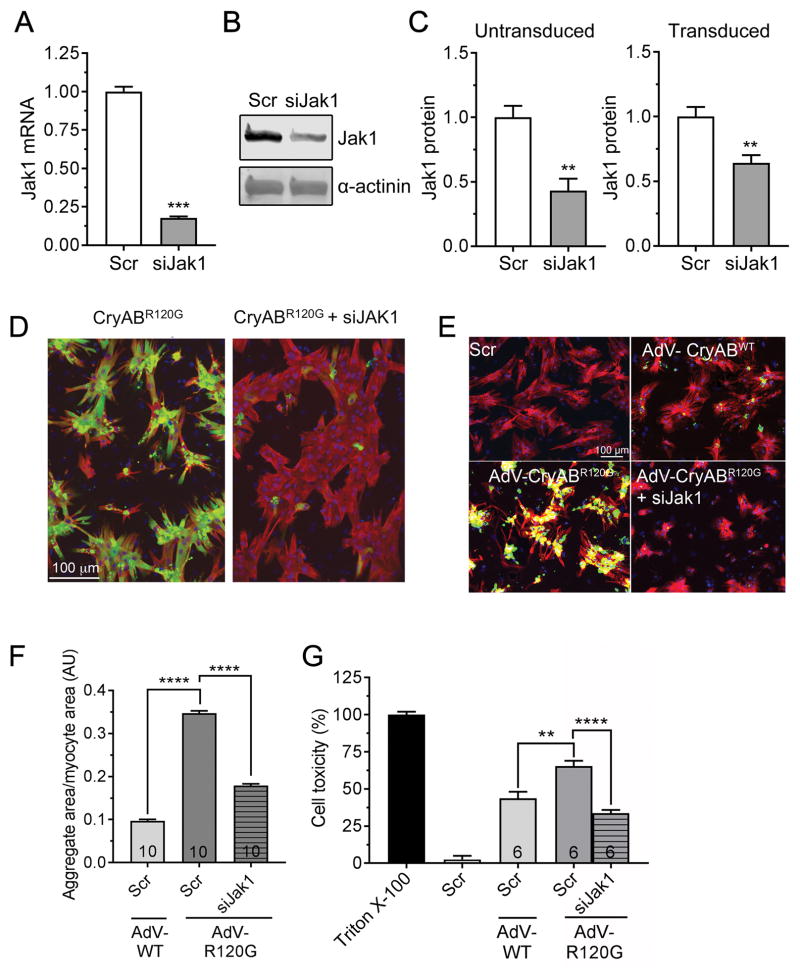
Figure 5. siJak1 knockdown in NRVM.
A, siRNA-mediated Jak1 knockdown in NRVMs was done as described in Methods and RNA quantitated via qPCR. B, Protein was isolated from the transfected cultures and assayed for Jak1 via Western blotting as described in Methods. C, The efficacy of Jak1 knockdown by siRNA was assayed with and without transfection of the cells with CryABR120G-containing adenovirus after 48–72 hours. D, Decreased Jak1 decreases aggregate load in NRVMs. Reduction of Jak1 levels resulted in a significant reduction in aggregate content after 48–72 hours. Data are depicted as mean ± SEM with **P<0.01 and ***P<0.001, unpaired Student’s t-test (n=3–4). E, NRVMs were transfected with scrambled siRNA (scr) or siJak1 and transduced with adenovirus (AdV) encoding wildtype CryAB or CryABR120G or left untransduced and aggregate accumulations visualized and F, quantitated after 7 days. G, Cytotoxicity measured 7 days after transduction. In E, nuclei are depicted in blue, GFP-CryAB in green and cardiac troponin I (cardiomyocyte marker) in red. Cell toxicity was measured using the lactate dehydrogenase assay as detailed in Methods. Triton X-100 was used as 100% and untransduced cells as 0%. Data are presented as mean ± SEM with **P<0.01 and ****P<0.0001, one-way ANOVA, Tukey’s post-hoc analysis. The number of images (F) or wells (G) is indicated in the histograms’ bars.

