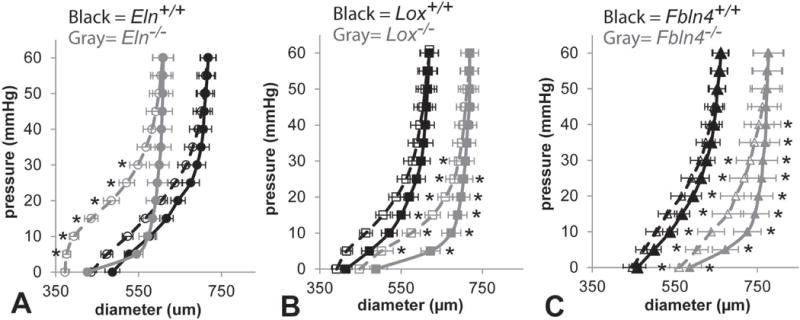
Fig. 6.

Average outer diameter vs. pressure curves for newborn Eln (A), Lox (B), and Fbln4 (C) AAs held at 1.05 axial stretch. The average outer diameter was calculated for every 5 mmHg pressure increment. All KO diameters are significantly different from WT at 5 – 30 mmHg for the loading data. Lox−/− and Fbln4−/− AAs show diameter differences from their respective WT controls for the unloading data as well. All KO AAs show larger differences between the loading and unloading behavior than WT. Open symbols, dotted lines = loading. Filled symbols, solid lines = unloading. * = P < .05. Mean ± SEM. N = 6 – 8/group.
