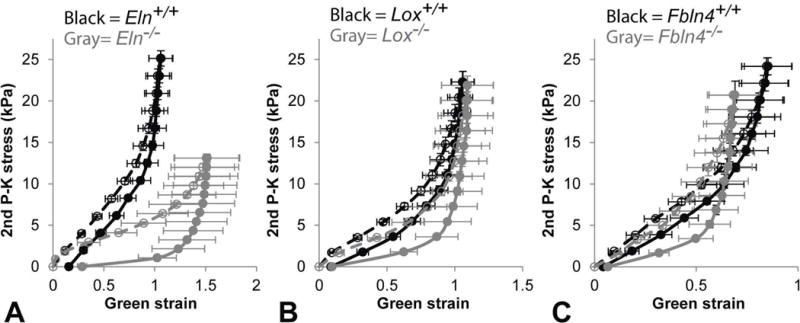
Fig. 7.

Average Green strain vs. second Piola-Kirchoff (2nd P–K) stress curves for newborn Eln (A), Lox (B), and Fbln4 (C) AAs pressurized cyclically from 0 – 60 mmHg at 1.05 axial stretch. The average strain and stress were calculated from the outer diameter at every 5 mmHg pressure increment. Eln−/− curve is shifted to the right, Lox−/− curve is similar to, and Fbln4−/− curve is shifted to the left of their respective WT controls. All KO AAs show larger differences between the loading and unloading behavior than WT. Filled symbols, solid lines = unloading. Mean ± SEM. N = 6 – 8/group.
