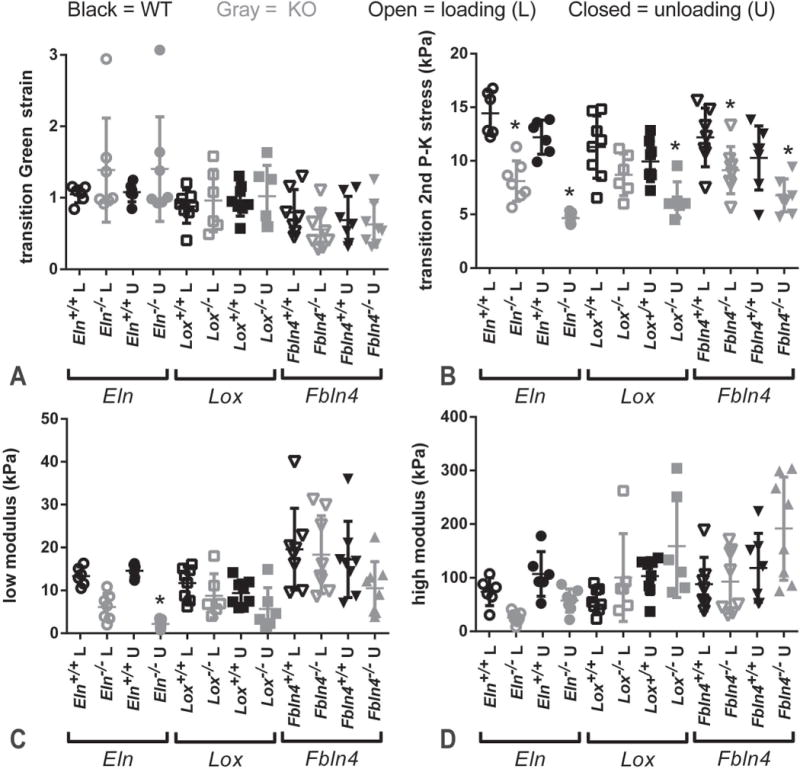
Fig. 9.

Quantification of Green strain vs. second Piola-Kirchoff (2nd P–K) stress curves for newborn mouse AAs. The transition between the low and high modulus values is thought to represent the point at which the AA mechanical behavior shifts from elastin-dominated at low pressure to collagen-dominated at high pressure. The transition Green strain is similar across groups (A). The transition 2nd P–K stress is reduced in most KO groups for loading and unloading (B). The low modulus is decreased only in Eln−/− AA for unloading (C). The high modulus is similar across groups (D). * = P < .05. Mean and SD are marked in the scatter plots. N = 6 – 8/group.
