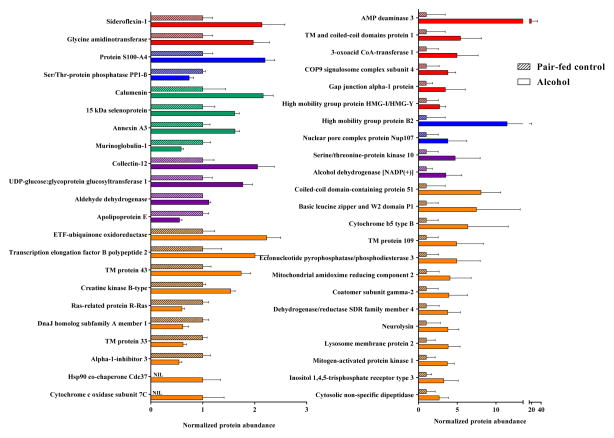
Figure 1.
Mass spectrometry analysis of alcohol-induced alteration of placental proteins. 45 proteins were identified as significantly different (P < 0.05) between the pair-fed control and alcohol groups when quantified by both normalized spectral counts method with Mascot/Scaffold, and by iBAQ analysis with MaxQuant. Colors depict protein function categorization: Red – Gestational diseases, fetal development; Blue – Neurodevelopment; Green – Implantation; Purple – Alcohol metabolism, nutrition, and immune function; and Orange – Cellular function. Data are represented as mean ± SEM.

