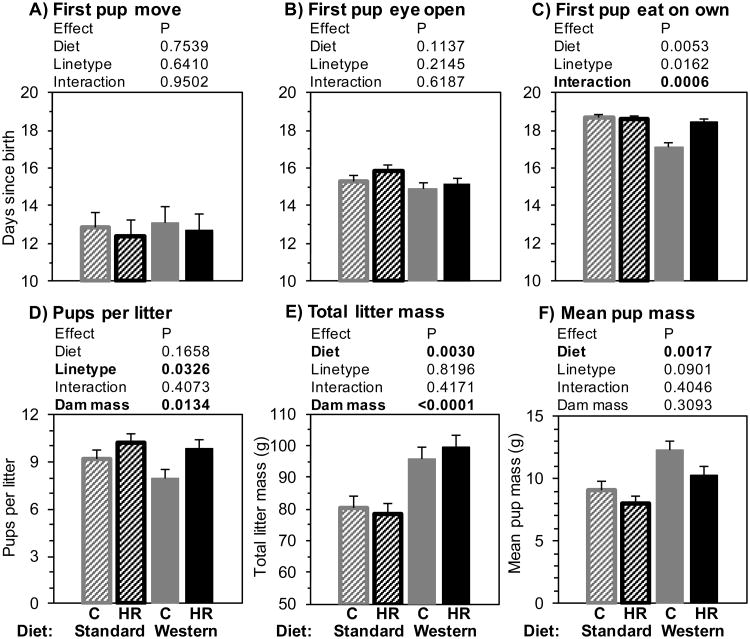
Fig. 2.
Litter characteristics. A-C: the first day that developmental markers were observed for at least one pup in any litter. D-F: number of pups per litter and total and mean pup mass at weaning (3 weeks after birth), adjusted for dam mass (grand mean = 29.34g, standard deviation = 3.38g). N = 25 per group. Bars represent least-squares means (LSM) + standard error (SE). Striped bars indicate maternal standard diet, solid bars indicate maternal Western diet, grey bars are control mice, and black bars are high-runner (HR) mice. Results of statistical analyses (fixed effects) are shown above each graph. All analyses included covariates of dam age (not shown).

