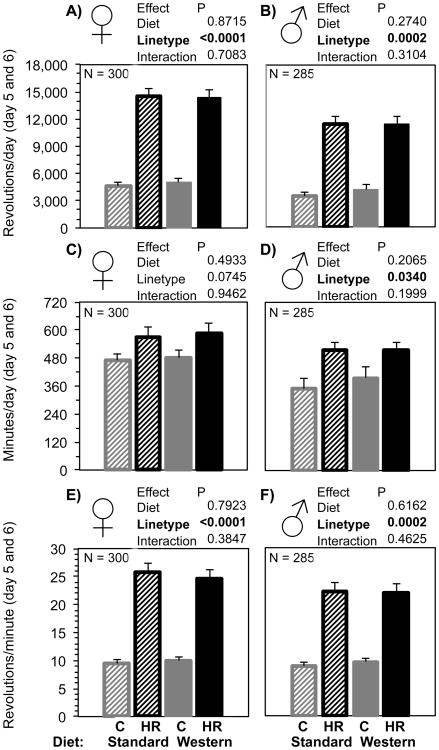
Fig. 7.
Total voluntary wheel running revolutions, duration, and average speed of days 5+6 of 6 days of wheel access of adult C and HR mice given maternal SD or WD, with separate analyses for females and males. Bars are age- and wheel-freeness-adjusted LSM + SE and N were approximately equal for each group. Striped bars indicate maternal standard diet, solid bars indicate maternal Western diet, grey bars are control mice, and black bars are high-runner (HR) mice. Results of statistical analyses (fixed effects) are shown above each graph. All analyses included covariates of age (not shown).

