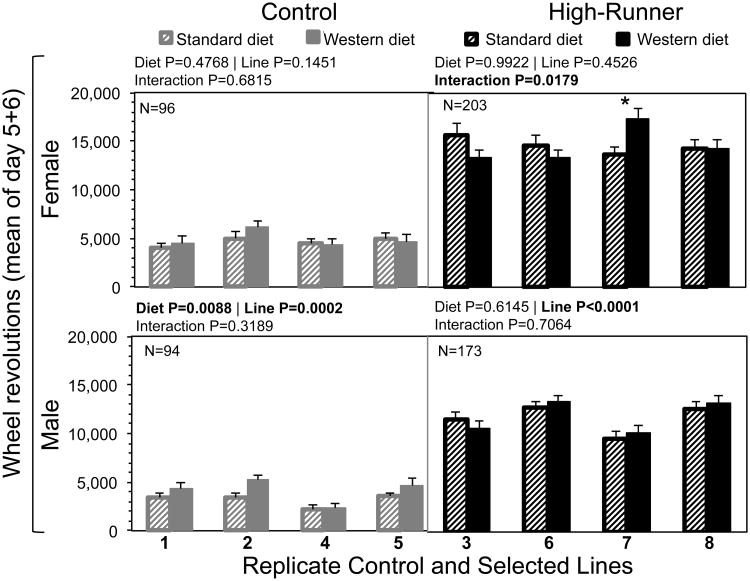
Fig. 8.
Total wheel revolutions of adult mice given maternal standard diet (striped bars) or Western diet (solid bars), with separate analyses for sex and replicate control (in grey) and high-runner (in black) lines. Bars are LSM + SE (age and wheel freeness used as covariates). Total N is shown in the upper left-hand corner, and Ns were approximately equal for each line within linetype and diet within line. Results of statistical analyses (fixed effects) are shown above each graph. Asterisks indicate differences of LSM within each line between diets (P < 0.05) from SAS Procedure Mixed. All analyses included covariates of age (not shown).

