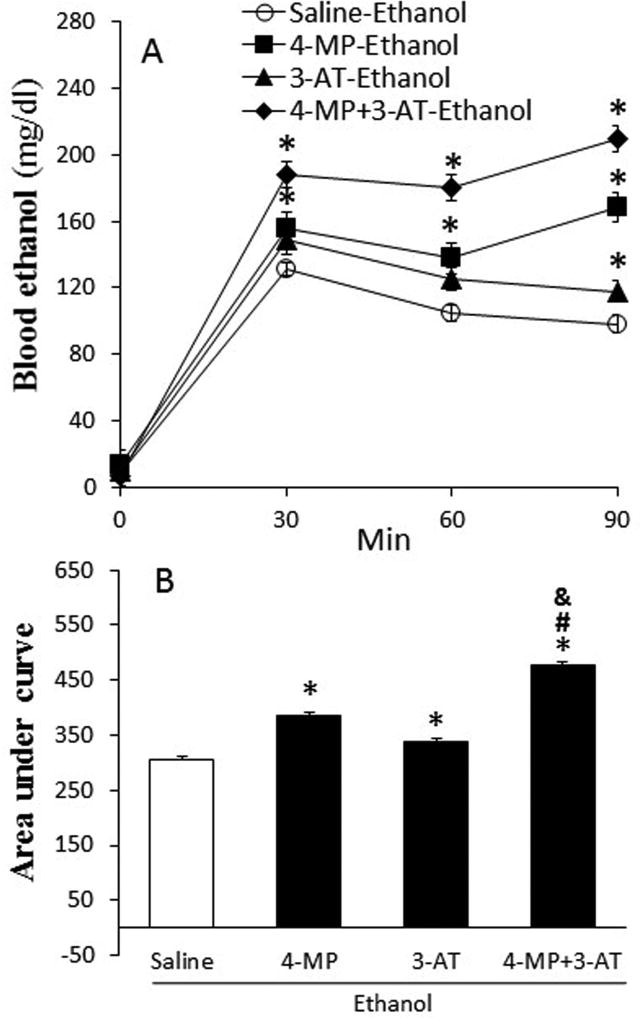
Fig. 4.
Ethanol metabolism was suppressed by inhibition of ADH, CYP2E1 and catalase by 4-MP, 3-AT or their combination. Panel A shows the time curse of blood ethanol concentration at 30, 60, and 90 min after ethanol infusion (1.5 g/kg; i.v). The bar graph (B) represents the areas under curves in these groups. Values are mean ± SEM. Data were analyzed by one-way ANOVA followed by Tukey's Multiple Comparison Test. *p < 0.05, versus saline. #p < 0.05, versus 4-MP. &p < 0.05, versus 4-MP+3-AT.

