
Figure 3.
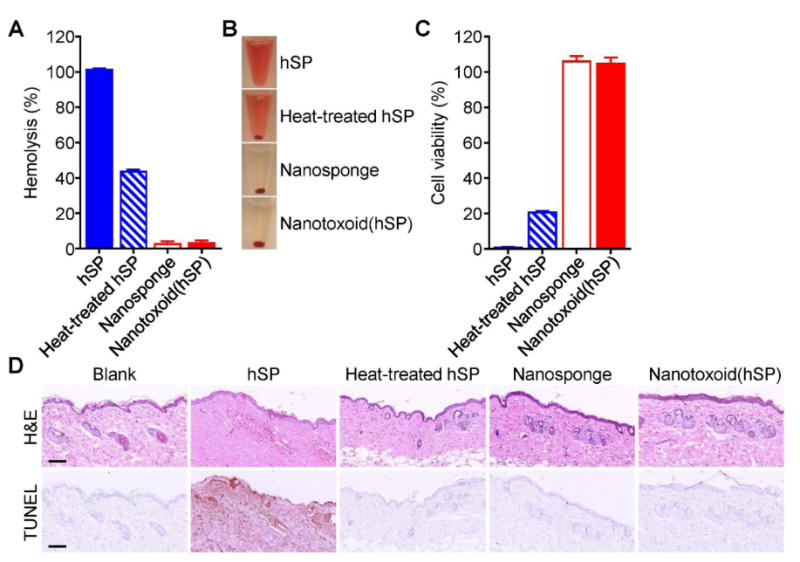
In vitro and in vivo safety studies. A) Comparison of hemolysis induced by hSP, heat-treated hSP, blank nanosponge, and nanotoxoid(hSP) (n = 3; mean ± SD). B) Representative images demonstrating the varying degrees of hemolysis in the samples from (A). C) Comparison of bone marrow-derived dendritic cell viability after 24 hours of incubation with hSP, heat-treated hSP, blank nanosponge, or nanotoxoid(hSP) followed by another 48 hours of culture (n = 4; mean ± SD). D) Hematoxylin and eosin (H&E) and TUNEL staining of skin samples collected from untreated mice or from mice 48 hours after subcutaneous injection of hSP, heat-treated hSP, blank nanosponge, or nanotoxoid(hSP) (scale bars = 100 μm).