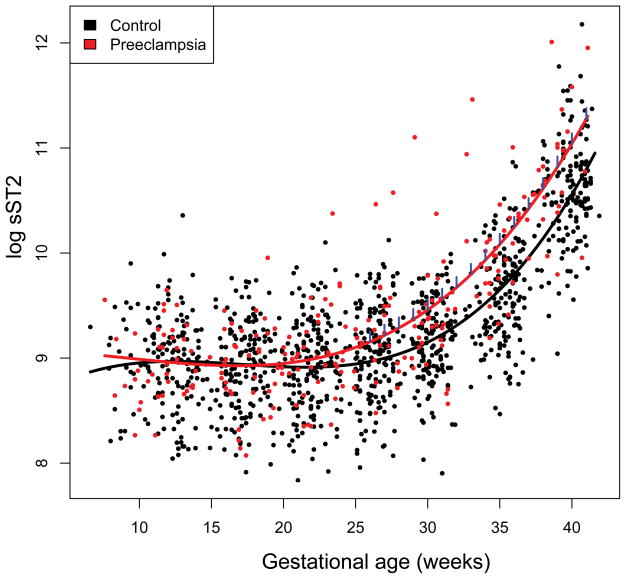
Figure 1.
Longitudinal profiles of plasma sST2 concentration. Maternal plasma concentration of sST2 (log, base e, thereof) in women with normal pregnancy (black dots) and those who subsequently developed preeclampsia (red dots). The gestational age dependence of the sST2 concentration in women with normal pregnancy (black line) and those with preeclampsia (red line) was estimated using a linear mixed-effect model and a third degree polynomial function. The blue vertical lines on the preeclampsia curve denote statistical significance of the difference between the two groups at the corresponding gestational age according to a linear mixed-effects model adjusting for covariates (gestational age at venipuncture, nulliparity, and smoking).

