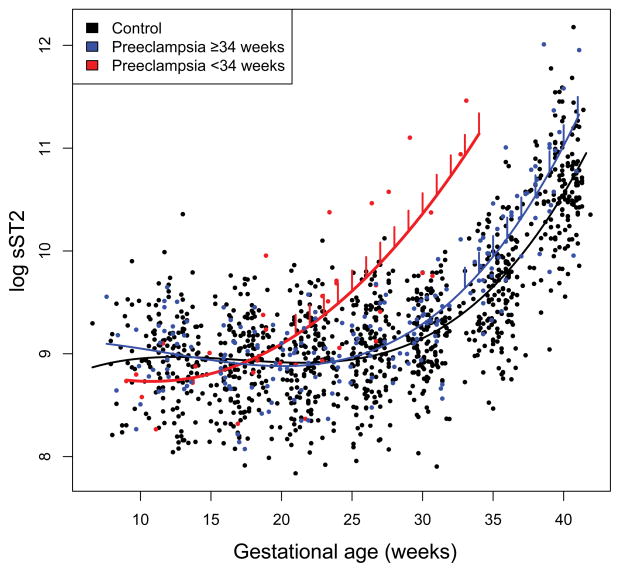
Figure 2.
Longitudinal profiles of plasma sST2 concentration in early-onset and late-onset preeclampsia. Maternal plasma concentration of sST2 (log, base e, thereof) in women with normal pregnancy (black dots), early-onset preeclampsia (delivered < 34 weeks of gestation; red dots), and late-onset preeclampsia (blue dots). The gestational-age dependence of the sST2 concentration in women with normal pregnancy (black line), the early-onset preeclampsia group (red line), and the late-onset preeclampsia group (blue line) was estimated using a linear mixed-effect model and a third degree polynomial function. The vertical lines on the preeclampsia curve denote statistical significance of the difference between the preeclampsia and normal pregnancy at the corresponding gestational age according to a linear mixed-effects model, adjusting for covariates (gestational age at venipuncture, nulliparity, and smoking).

