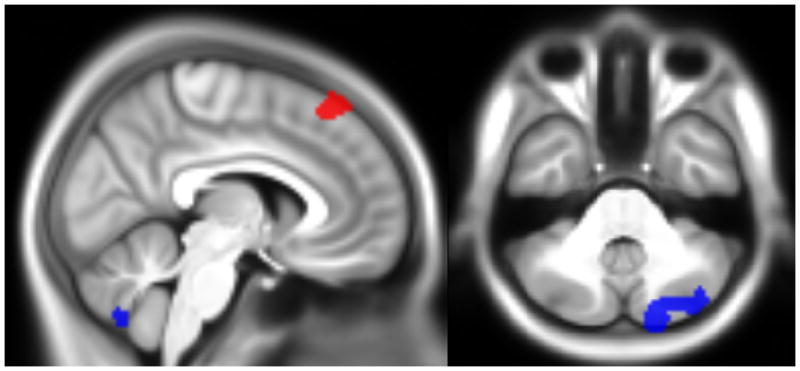
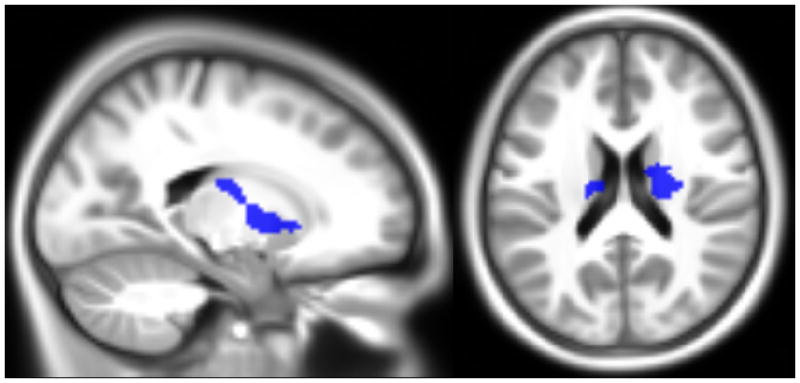
Figure 2.


Location of the clusters surviving multiple comparison correction at P<.01, overlaid onto the sample’s average anatomical image. The top part (X=6, Y= −60, Z=−36) shows where there was an effect of ADHD severity (red) and the interaction between anxiety and ADHD (blue) on brain activity for the mean working memory contrast; the bottom part (X=−20, Y=−10, Z=20) shows the clusters with a significant effect of the interaction between anxiety and ADHD for the memory load difference contrast.
