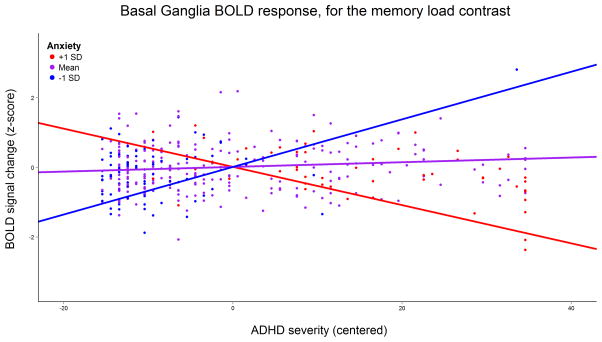
Figure 3.
Graph of the mean blood-oxygen level dependent (BOLD) signal change at the clusters in the striatum and thalamus (clusters combined), for the memory load contrast. Regression lines indicate effect of ADHD severity for average anxiety severity (purple line), as well as one standard deviation above (blue line) and below (red line) average anxiety severity.

