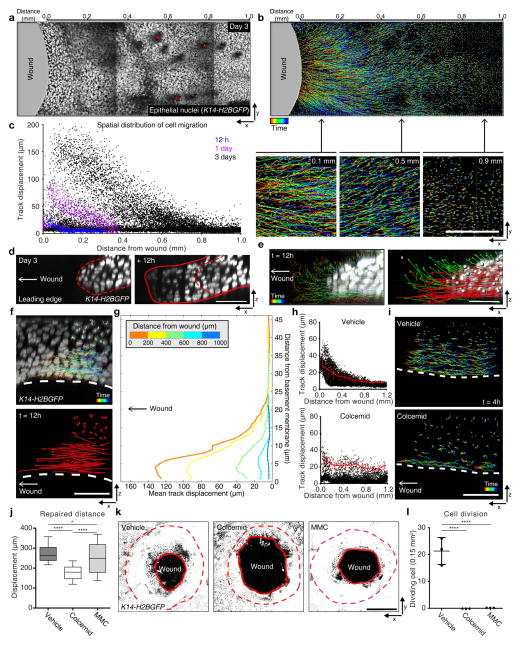
Figure 1. Migration of differentiated layers of skin epithelium contributes to re-epithelialization.
(a) Time-lapse image of skin epithelial nuclei 3 days PWI using K14-H2BGFP mice (red asterisks, hair canals). (b) Imaris track analysis of epithelial nuclei 3 days PWI. Colors project time (blue, beginning; red, end). Scale bar, 1 mm. (c) Total displacement of individual cell tracks over 12 hours plotted as a function of distance from the wound; Imaging performed at 12 hours (blue), 1 day (purple) and 3 days (black) PWI (n=3 mice respectively). (d) Still images of the leading edge 3 day PWI and 12 hours later using K14-H2BGFP. Scale bar, 50 μm. (e) Cell tracks and displacement vectors of the leading edge (parallel (<5°), red arrow; upward (≥5°), green arrow). Scale bar, 50 μm. (f) x-z view of cell tracks located behind the leading edge. Scale bar, 50 μm. (g) Mean displacement of cell tracks that initiated within 200 μm segments of tissue plotted as a function of both distance from the wound and the basement membrane (n= 2 mice, t=12 hours). (h) Representative quantification of the migration tracks 3 days PWI. Every 100 μm from the initial wound, the displacement of migrating cell tracks are averaged (red). Mean ± S.D. (Vehicle, n=14232 tracks from 2 mice; Colcemid, n=5523 tracks from 2 mice). (i) x-z view of cell tracks after vehicle and Colcemid treatments. Scale bar, 50 μm. (j) Box plot of epidermal wound closure by determining the leading edge distance from the initial wound site. Mean ± S.D. Horizontal lines are the median values, the edges of the boxes are from 25 to 75 percentiles, the whiskers extend from Min to Max. * p<0.05 and **** p<0.0001, unpaired Student’s t-test (n=180 points pooled from n=3 mice). (k) Whole wound image 3 days PWI from Vehicle, Colcemid and MMC-treated mice. z-stacks of epidermis is projected (~50 μm from granular layer). Dotted line, initial wound boundary; solid line, edge of the repaired epithelium. Scale bar, 500 μm. (l) Cell division rate 3 days PWI from Vehicle, Colcemid and MMC-treated mice. Dividing cells, 1 mm from the wound, are quantified per 0.15mm2. Mean ± S.D. **** p<0.0001, unpaired Student’s t-test (t=4 hours; n=3 mice). Images shown in a, b, d, e, f, i and k are representative of 3 mice.

