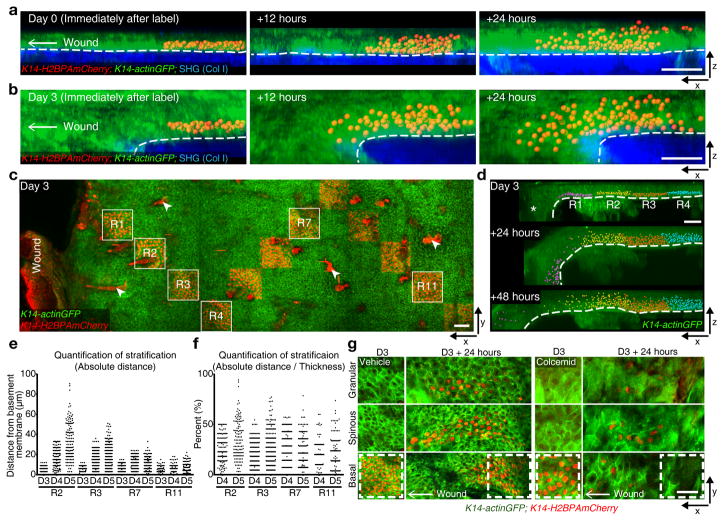
Figure 2. Migration enhance differentiation.
(a, b) x-z view of labeled cells rendered with Imaris software as an x-z projection and their sequential changes in position from 0 day (a) and 3 days (b) PWI (representative images from 3 mice). Labeled cells (K14-H2BPAmCherry), red; epidermis (K14-actinGFP), green; dermis (SHG), blue. Scale bar, 50 μm. (c) Staggered frame tile labeling of H2BPAmCherry cells in the basal layer at varying distance from the wound using K14-H2BPAmCherry;K14-actinGFP (representative images from 3 mice). Arrowheads indicated strong red auto-fluorescence from the hair shafts. Scale bar, 50 μm. (d) Imaris visualization of labeled cells and their sequential changes in regions 1–4 (R1, purple; R2, yellow; R3, red; R4, blue; representative images from 3 mice). Asterisk indicates a fold in the epidermis. Scale bar, 50 μm. (e) Representative quantification of absolute upward cell stratification at different distances from the wound. y-axis represents the absolute value of distances of labeled cells from the basement membrane (representative graph derived from n=1823 labeled cells from n=2 mice). (f) Representative quantification of relative upward cell stratification, normalized to epidermal thickness, at different distances from the wound. y-axis represents distance of labeled cells from the basement membrane represented as a percentage of epidermal thickness (representative graph derived from n=1327 labeled cells from n=2 mice). (g) Basal cell labeling at 3 days PWI and 24 hours later in Vehicle and Colcemid-treated wounds using K14-H2BPAmCherry;K14-actinGFP (representative images from 3 mice). Scale bar, 50 μm.

