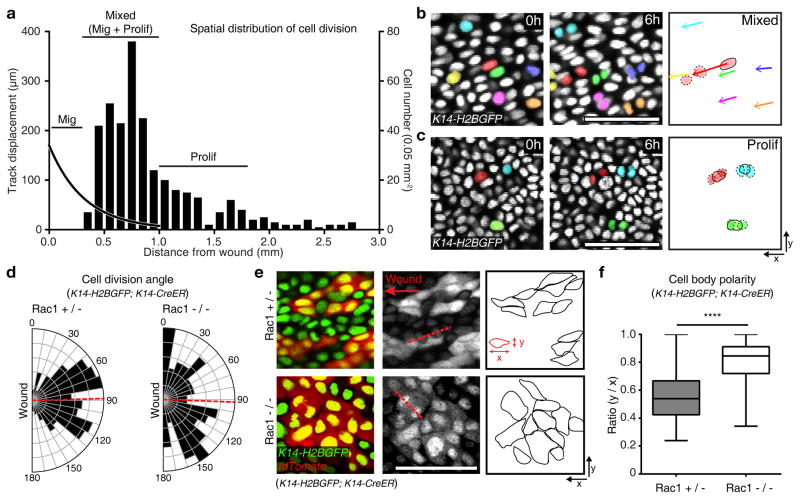
Figure 3. Migration controls cell division.
(a) Representative quantification of cell divisions relative to the distance from the wound boundary using K14-H2BGFP (representative graph derived from n=409 cells from n=3 mice). The left hand axis and curved black trend-line represents the cell track displacement trend observed over 12 hours of imaging. The right hand y axis and column plot indicates the cell divisions based on nuclei counts per 0.05 mm2. The plot is annotated with the identified regions of migration, mixed (migration and proliferation) or proliferation zones. (b, c) Representative cell divisions and migration in the mixed (b) and the proliferation zone (c) (n=3 mice). Scale bar, 50 μm. (d) Quantification of cell division axes in the Rac1+/− and Rac1−/− (Rac1+/− n=197 cells pooled from 3 mice and Rac1−/− n=99 cells pooled from 3 mice). Cell division axes were measured with respect to the wound edge. A red dashed line indicates average of angles (88.48° in Rac1+/− and 92.05° in Rac1−/−). (e) Cell shape changes in Rac1+/− and Rac1−/− mice per 0.7 mm2 over a 4 hours period. Recombined cells are indicated by the presence of tdTomato expression and outlined in the third panel (representative images from n=3 mice). (f) Box plot quantifying cell body polarity in the Rac1+/− and Rac1−/−. The polarity is measured by ratio of y/x values of 150 randomly picked tdTomato positive cells in Rac1+/− and Rac1−/− epidermis respectively 3 days PWI. Horizontal lines are the median values, the edges of the boxes are from 25 to 75 percentiles, the whiskers extend from Min to Max. Mean ± S.D. **** p<0.0001, unpaired Student’s t-test (n=150 cells pooled from n=3 mice). Scale bar, 50 μm.

