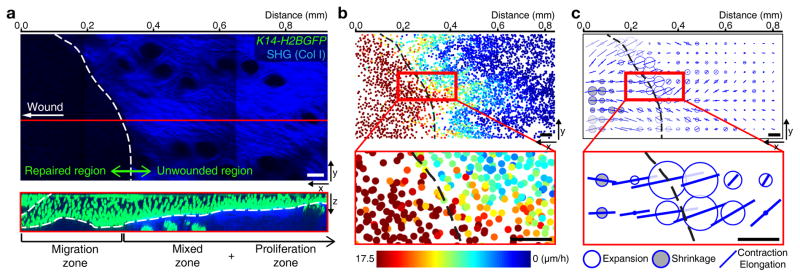
Figure 4. Tissue expansion occurs at a distinctive area near wound.
(a) Different regions pattern the unwounded and repaired epithelium. Projection of the SHG in the dermis (top panel). White dotted line surrounds initial wounded region, which is negative for SHG signal. x-z view of red line (bottom panel) indicating that the left region without SHG (repaired epithelium) is the migration zone and the right region with SHG (unwounded epithelium) is the mixed and the proliferation zones (representative images from 3 mice). Scale bar, 50 μm. (b) Nuclei in the basal layer from K14-H2BGFP mice are represented as dots of different colors reflecting their displacement over 4 hours (representative images from 2 mice). Black dotted line surrounds initial wounded region. Scale bar, 50 μm. (c) Tissue deformation of the basal layer (representative images from 2 mice). White balls represent tissue expansion, black balls represent tissue shrinkage, and bars represent contraction/elongation rate and direction. Black dotted line surrounds initial wounded region. Scale bar, 50 μm.

