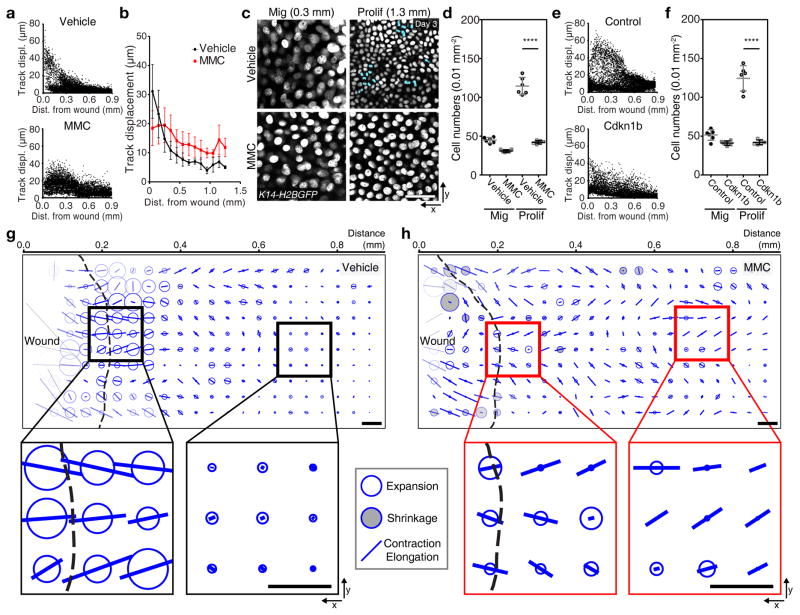
Figure 5. Inhibition of proliferation changes repairing area.
(a) Representative quantification of cell tracks in the vehicle and the MMC-treated wound using K14-H2BGFP (Vehicle, n=8155 tracks from n=3 mice; MMC, n=9177 from n=3 mice). (b) Plot of cell tracks vs. distance from the initial wound boundary. Migrating cell tracks are averaged every 100 μm from the initial wound. Mean ± S.D. (Vehicle, n=8155 tracks from n=3 mice; MMC, n=9177 from n=3 mice). (c) Inhibition of cell division after MMC treatment. Proliferating cells are pseudo-colored in blue (representative images from 3 mice). Scale bar, 50 μm. (d) Representative quantification of cell density after MMC treatment. Mean ± S.D. **** p<0.0001, unpaired Student’s t-test (n=6 squares each sample pooled from 3 mice). (e) Representative quantification of migration tracks in the control and the Cdkn1b overexpressed wound using K14-rtTA;tetO-Cdkn1b;K14-H2BGFP (Control, n=7106 tracks from n=3 mice; MMC, n=9151 from n=3 mice). (f) Representative quantification of the cell density after Cdkn1b overexpression per 0.01 mm2. Mean ± S.D. **** p<0.0001, unpaired Student’s t-test (n=6 squares each sample pooled from 3 mice). (g, h) Tissue deformation after inhibition of the proliferation by MMC treatment. The tissue deformation analysis is performed in the Vehicle (g) and the MMC (h)-treated K14-H2BGFP mice (representative analysis from 2 mice). Scale bar, 50 μm.

