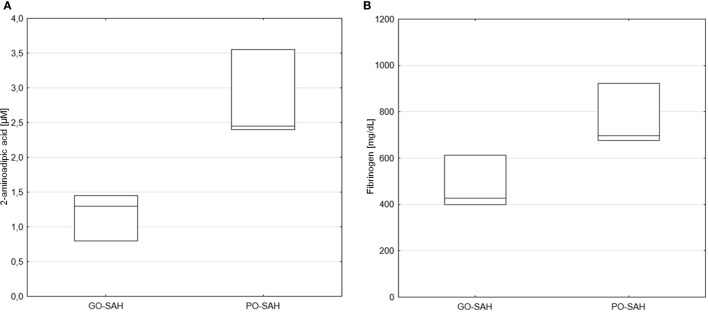
Figure 3.
Significant differences in monitored parameters on day 10 post-SAH between patients with good (GO-SAH) and poor (PO-SAH) treatment outcome. Mann–Whitney test revealed significantly higher 2-aminoadipic acid (p = 0.033) (A) and fibrinogen (p = 0.014) (B) levels in patients with poor outcome. Median levels and the 25th and 75th percentiles are presented.

