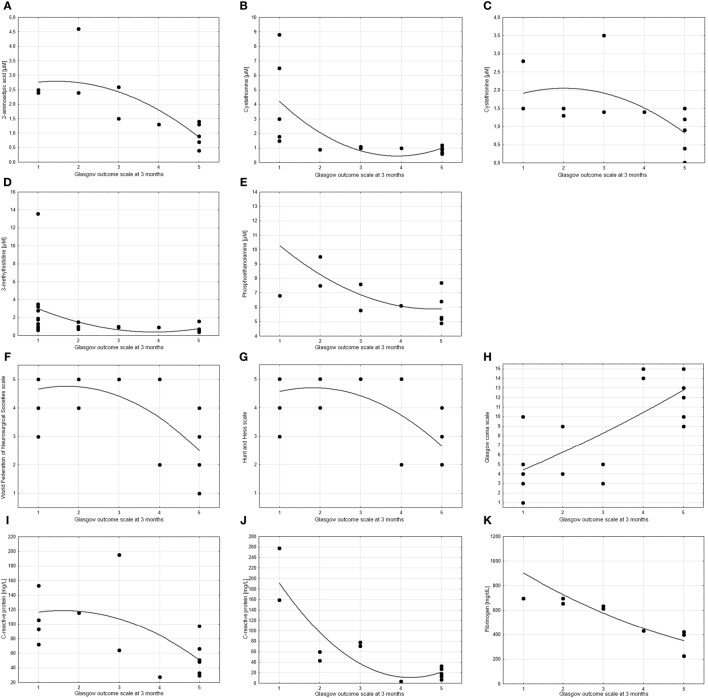
Figure 4.
Scatter charts showing the correlation between treatment outcome (measured by Glasgow Outcome Scale at 3 months) and other parameters. Spearman’s test revealed significant correlations (cc > 0.6 or cc < −0.6) for (A) 2-aminoadipic acid on day 10 post-SAH (cc = −0.81), (B,C) cystathionine on day 5 post-SAH (cc = −0.72) and day 10 post-SAH (cc = −0.67), (D) 3-methylhistidine on days 0–3 post-SAH (cc = −0.64), (E) o-phosphoethanolamine on day 10 post-SAH (cc = −0.62), (F) World Federation of Neurosurgical Societies scale (cc = −0.64), (G) Hunt and Hess scale (cc = −0.61), (H) Glasgow coma scale (cc = 0.72), (I,J) C-reactive protein on day 5 post-SAH (cc = −0.64) and day 10 post-SAH (cc = −0.79), and (K) fibrinogen on day 10 post-SAH (cc = −0.97). p values are <0.05 in all cases.

