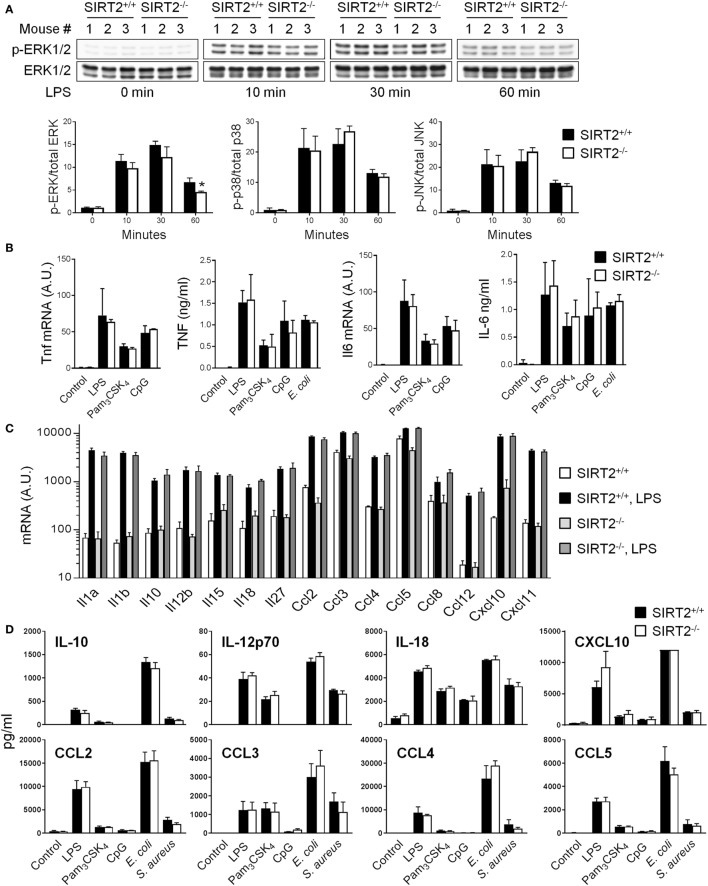
Figure 4.
Sirtuin 2 (SIRT2) deficiency does not affect the response of macrophages to microbial stimulation. SIRT2+/+ and SIRT2−/− BM-derived macrophages were exposed to lipopolysaccharide (LPS) (10 ng/ml), Pam3CSK4 (10 ng/ml), CpG (2 µg/ml), Escherichia coli (106 CFU/ml), and Staphylococcus aureus (106 CFU/ml). (A) Expression levels of phosphorylated (p) and total ERK1/2 (upper panel), p38 and JNK were analyzed by western blotting and quantified by imaging. Data are means ± SD from one experiment performed with three mice (lower panel) (*P = 0.02). (B) Tnf and Il6 mRNA levels and TNF and IL-6 concentrations in cell culture supernatants 1 and 8 h after stimulation, respectively. (C) Il1a, Il1b, Il10, Il12b, Il15, Il18, Il27, Ccl2/Mcp1, Ccl3/Mip1a, Ccl4/Mip1b, Ccl5/Rantes, Ccl8/Mcp2, Ccl12/Mcp5, Cxcl10/Ip10, Cxcl11/Itac mRNA levels after 8 h of culture with or without LPS. (D) IL-10, IL-12p70, IL-18, CXCL10, CCL2, CCL3, CCL4, and CCL5 concentrations in cell culture supernatants 8 h after stimulation measured by Luminex. Data are means ± SD of triplicate samples from one experiment performed with three mice (mRNA analyses) or six mice (TNF and IL-6 secretion), or means ± SD of single measurements from one experiment performed with three mice (Luminex). CXCL10 values in response to E. coli were over the upper limit of detection of the assay. No statistically significant differences were detected in (B–D). A.U., arbitrary units. Full-length blots of panel (A) are presented in Figure S4 in Supplementary Material.

