Fig. 3.
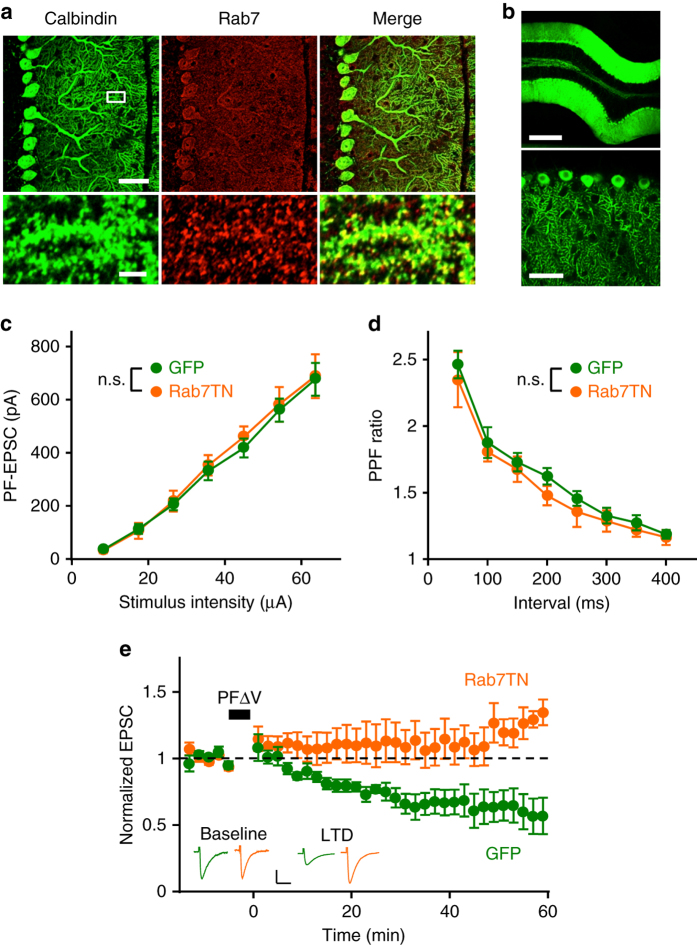
Rab7-dependent LE sorting is involved in LTD. a Confocal images of a cerebellar slice double stained with antibodies against calbindin (green) and Rab7 (red). Scale bars: top, 40 μm; bottom, 4 μm. The area within the white square is magnified in the lower panels. b Images of a cerebellar slice expressing GFP-Rab7TN in PCs. Scale bars: top, 300 μm; bottom, 50 μm. c Amplitudes of PF-EPSCs elicited by PF stimuli of increasing intensity (8.2, 17.4, 26.5, 35.6, 44.9, 54.2, and 63.6 μA), which were recorded from PCs expressing GFP alone (green circles, n = 10), or GFP-Rab7TN (orange circles, n = 6). d Paired pulse facilitation (PPF) ratios of PF-EPSCs elicited by a pair of PF stimuli with different intervals (50–400 ms) from PCs expressing GFP alone (green circles, n = 13), or GFP-Rab7TN (orange circles, n = 12). e Time course of LTD induced by PFΔV in PCs expressing GFP alone (green circles, n = 9), or GFP-Rab7TN (orange circles, n = 8). Averaged traces of PF-EPSCs recorded before (baseline) and after PFΔV (LTD) are shown in the inset. Calibration: 100 pA, 30 ms. PF-EPSC amplitudes shown here as well as in the subsequent figures presenting the time course of PF-EPSCs are normalized to their mean prestimulation level. n.s., not significant. Exact P values for the data sets in this figure are provided in Supplementary Table 2

