Fig. 8.
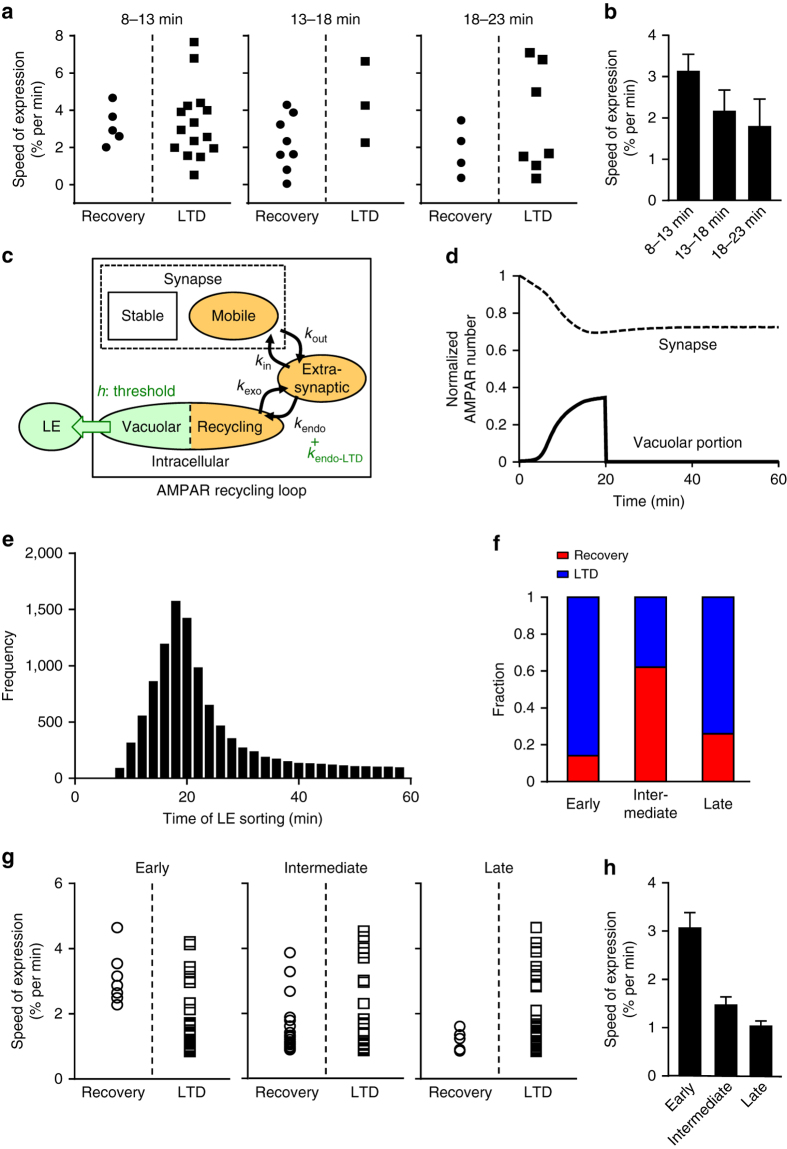
Combination of the speed of LTD expression and the threshold of LE sorting produces variability in the timing of LE sorting. a Experimental analyses of the speed of LTD expression (% reduction of PF-EPSCs per min) in the recovery and LTD groups upon photoactivation of PS-Rab7TN at 8–13 min (left), 13–18 min (middle), or 18–23 min (right). b Averaged speed of LTD expression in the recovery group. c Diagram of the advanced model. The switch-like behavior of LE sorting with a threshold (h) and an intracellular compartment destined for LE were added. The value of k endo was increased to mimic LTD expression (addition of k endo-LTD). d An example of LTD (dotted line) and the accompanying accumulation of the vacuolar portion as well as sorting to LE of AMPARs (solid line) simulated by the model shown in c. The peak time of k endo-LTD (τ) and threshold of LE sorting (h) used here were 10 and 0.345, respectively. e A histogram showing the appearance frequency of each timing of LE sorting, simulated by the model with varied peak time of k endo-LTD (τ) and threshold of LE sorting (h). f Simulated fractions of recovery (red) and LTD (blue) groups. g, h Analyses of the speed of LTD expression (% reduction of PF-EPSCs per min) in the model. Individual speeds of the recovery and LTD groups g and the average speed of the recovery group h are shown. Results of the model shown in f–h are obtained from different sets of 50 examples picked by simple random sampling, among all possible examples as shown in the histogram e

