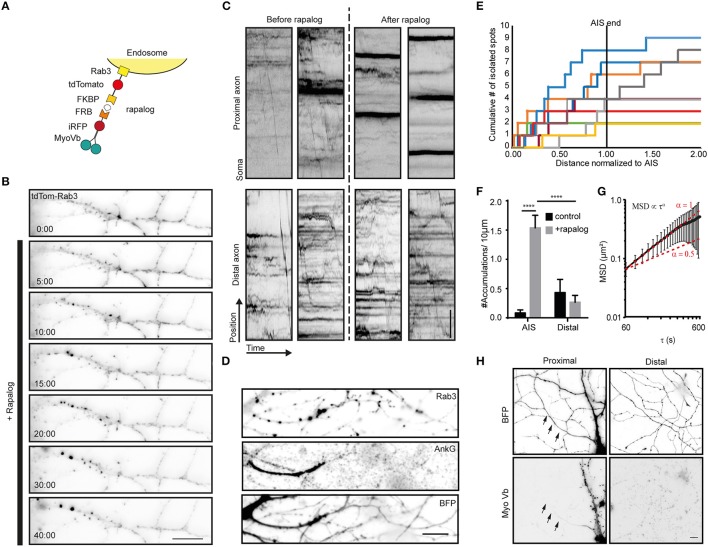
Figure 3.
Myosin-V anchors Rab3 vesicles in the proximal axon of hippocampal neurons. (A) Assay: Recruitment of myosin-V to Rab3 vesicles by addition of rapalog. (B) Rab3 positive vesicle distribution in the proximal axon. Upon coupling of myosin-Vb to vesicles by addition of rapalog, Rab3 vesicles start accumulating in big puncta. Scale bar, 10 μm. (C) Kymographs of Rab3 vesicles in the proximal and distal axon. Short timelapses were acquired with 500 ms intervals before and after addition of rapalog. For imaging of distal axons after rapalog treatment, cells were chosen 1 h after rapalog addition that showed clear Rab3 anchoring in their proximal axon. Scale bar, 5 μm. (D) Rab3 distribution after myosin-Vb recruitment, together with a staining for Ankyrin-G to indicate the AIS. BFP was used as a fill to show the overall morphology. Scale bar, 10 μm. (E) Plot of the cumulative number of Rab3 accumulations found in the axon normalized to the AIS determined for cells after rapalog addition to recruit myosin-Vb. (F) Number of accumulations found in the AIS and the distal axon as determined using Ankyrin-G staining. The number of accumulation were determined in fixed cells with and without addition of rapalog Mean ± sd (n = 9 for both conditions), 2-way ANOVA reveals Finteraction = 26.27, p = 0.0001. Post-hoc multiple comparison testing: ****p < 0.0001. (G) Mean square displacement analysis of myosin-V anchored peroxisome clusters tracked for at least 25 intervals of 20 s. Mean ± sd (n = 18). (H) Distribution of the MyoVb(1-1090)-EGFP-FRB construct. The axon is indicated by arrows. Scale bar, 10 μm.

