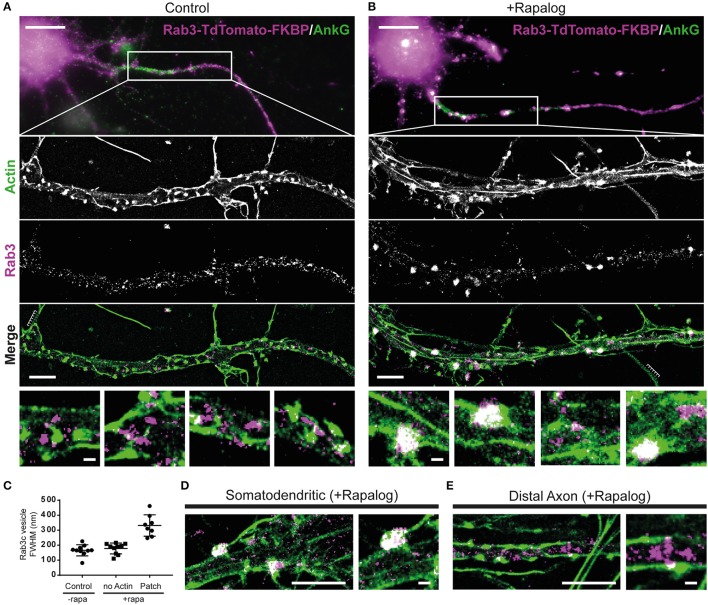
Figure 4.
Myosin-V-anchored Rab-3 vesicles accumulate on actin patches in the proximal axon. (A,B) Single molecule localization microscopy of sequentially imaged lifeAct-GFP protein-PAINT and DNA-PAINT to visualize actin and Rab3, respectively. DIV10 neurons overexpressing MyosinVb-HA-FRB and Rab3-tdTomato-FKBP, post-stained for TdTomato and AnkyrinG. Axons were identified by AnkyrinG staining. Super-resolution images are shown for the regions indicated in the widefield images (top panel). Control (A) and MyosinVb coupled Rab3 vesicles (B) are imaged together with actin (middle 3 panels). Scale bar: top panel 10 μm, middle panels 2 μm, zooms 0.2 μm. (C) Quantification of the FWHM of Rab3 structures in control and rapalog-treated cells. Myosin-coupled Rab3 vesicles were separated based on their colocalization with actin patches. Mean ± sd are depicted (n = 8–10 for 2 cells per condition). (D) Super-resolution image and zoom of Rab3 cluster colocalization with actin in the somatodendritic compartment. Scale bar: left panel 2 μm, right panel 0.2 μm. (E) Super resolution image and zoom of Rab3 vesicles and actin in the distal axon. Scale bar: left panel 2 μm, right panel 0.2 μm.

