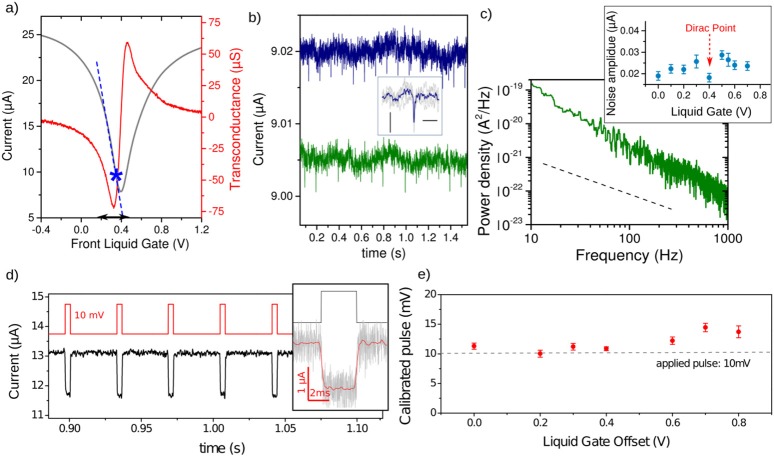
Figure 3.
Noise and stability of the G-FETs for potential pulse detection. (a) Field effect and transconductance of the G-FETs measured in the cell culture medium. Dashed blue line indicates the linear operation regime of the G-FET with the maximal sensitivity. The black arrows highlight the gate voltage range of the maximal sensitivity around VLG = 0.3 V. The blue star indicates the operating point for the pulses detection shown in (b). (b) Detection of 100 μV (blue) and 75 μV (green) potential pulses (applied to the cell culture medium through a Pt-electrode) by G-FETs biased at VDS = 50 mV and VLG = 0.32 V. Inset: zoomed of the superimposed G-FETs responses. Scale bars are 2.5 nA and 10 ms (c) Power spectral density of the current noise in liquid gated G-FETs (VLG = 0 V). A 1/f dependence on the frequency is observed (dashed line). Inset shows the noise amplitude as function of the liquid gate voltage. (d) G-FET response (black line) to square shaped potential pulses (red line) applied in cell culture medium. Inset: zoom of a pulse detected by G-FET (blackline), revealing a very fast response (~0.5 ms) to the applied square pulse signal (redline). Gray line is the unfiltered signal. (e) Calibrated pulse height from GFET transconductance (a) of the potential pulse VP = 10 mV showing that the calibrated pulse and the applied pulse are in very good agreement.

