Figure 4.
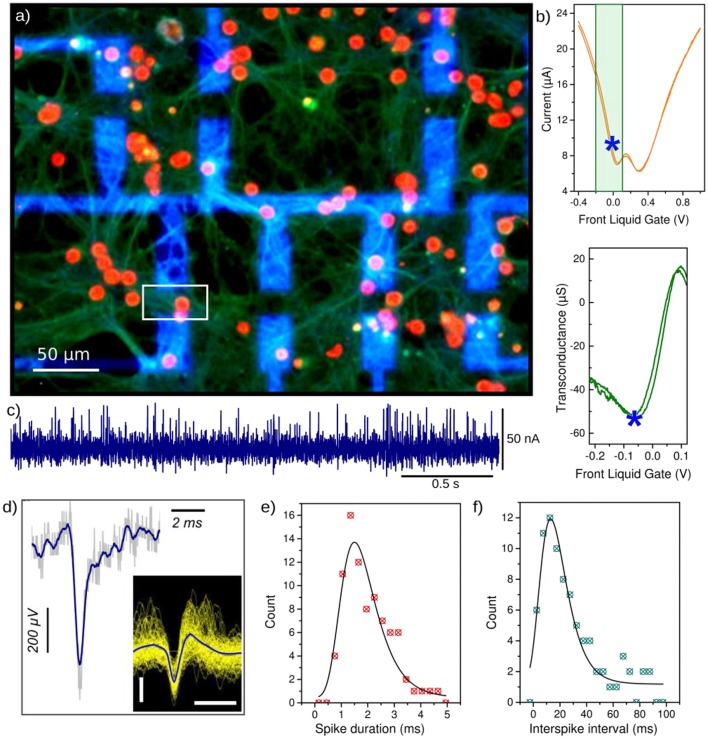
Primary hippocampal neurons interfaced with G-FETs (20 × 10 μm2). (a) Immuno-fluorescence micrographs of neurons on the G-FETs after 21 days of culture, stained with DAPI (red) and anti-Synapsin (green) to label the soma and the synaptic vesicles along the neuritis, respectively. The metal contact leads appear in blue and connect the graphene FET channel (the position of one G-FET is underlined with the white square for example). (b) G-FET current vs. liquid gate voltage, set using a Ag/AgCl reference electrode immersed into the cell culture medium (top) and corresponding transconductance curve (bottom) in the highest sensitive regime (underlined by the green square on the top curve). The blue star indicates the transistor working point with the highest sensitivity in the hole conduction regime. (c) Recording of neuronal activity by monitoring the ISD current of the G-FET underlined with a white square in (a), at the transistor working point indicated by a blue star in (b). The measurements were performed in cell culture medium (VSD = 100 mV). (d) The calibrated extracellular potential obtained from a single current spike, obtained from (c) and the transconductance value at the operating point (detailed in the text). The inset shows the superposition of all detected spikes. The scale bars are 200 μV and 2 ms. (e) Histograms showing the distribution of the spike duration and (f) distribution of the interspike interval (right).

