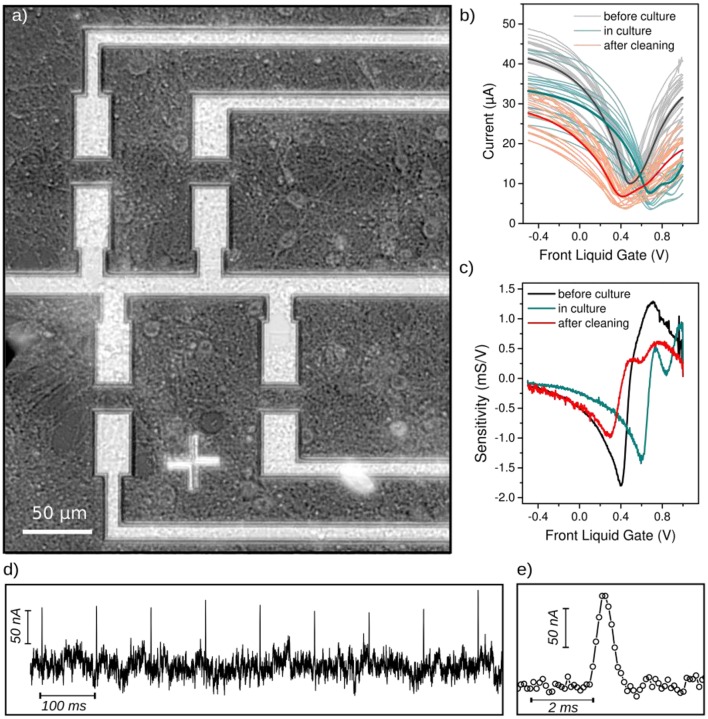
Figure 5.
Performance of the G-FETs after 3 weeks of neurons culture. (a) Optical micrograph of the dense neuronal networks cultured on G-FETs during 21 days. (b) Field effect of liquid gated G-FETs before culture (gray curves), covered with 21DIV neurons (blue curves), and after cleaning the chip (orange curves). Curves represent one device, except the darker one which is the average field effect curves for each condition. All measurements were performed in cell culture medium at VSD = 50 mV. (c) Average sensitivity of G-FETs before the culture (black), covered with neurons (blue) and after cleaning (red). The sensitivity was calculated from the average field effect curves in (b). (d) Potential pulse detection using G-FETs covered with neurons. A 1 ms long potential pulse Vp = 500 μV was applied to the cell culture medium through a Pt-electrode; the transistor working point was set to the highest sensitivity, and the current through the FET-channel was measured at VSD = 100 mV. (e) Zoomed view of an individual current pulse detected in (d). A Pt-reference electrode was used as the gate electrode for all the measurements.

